
|
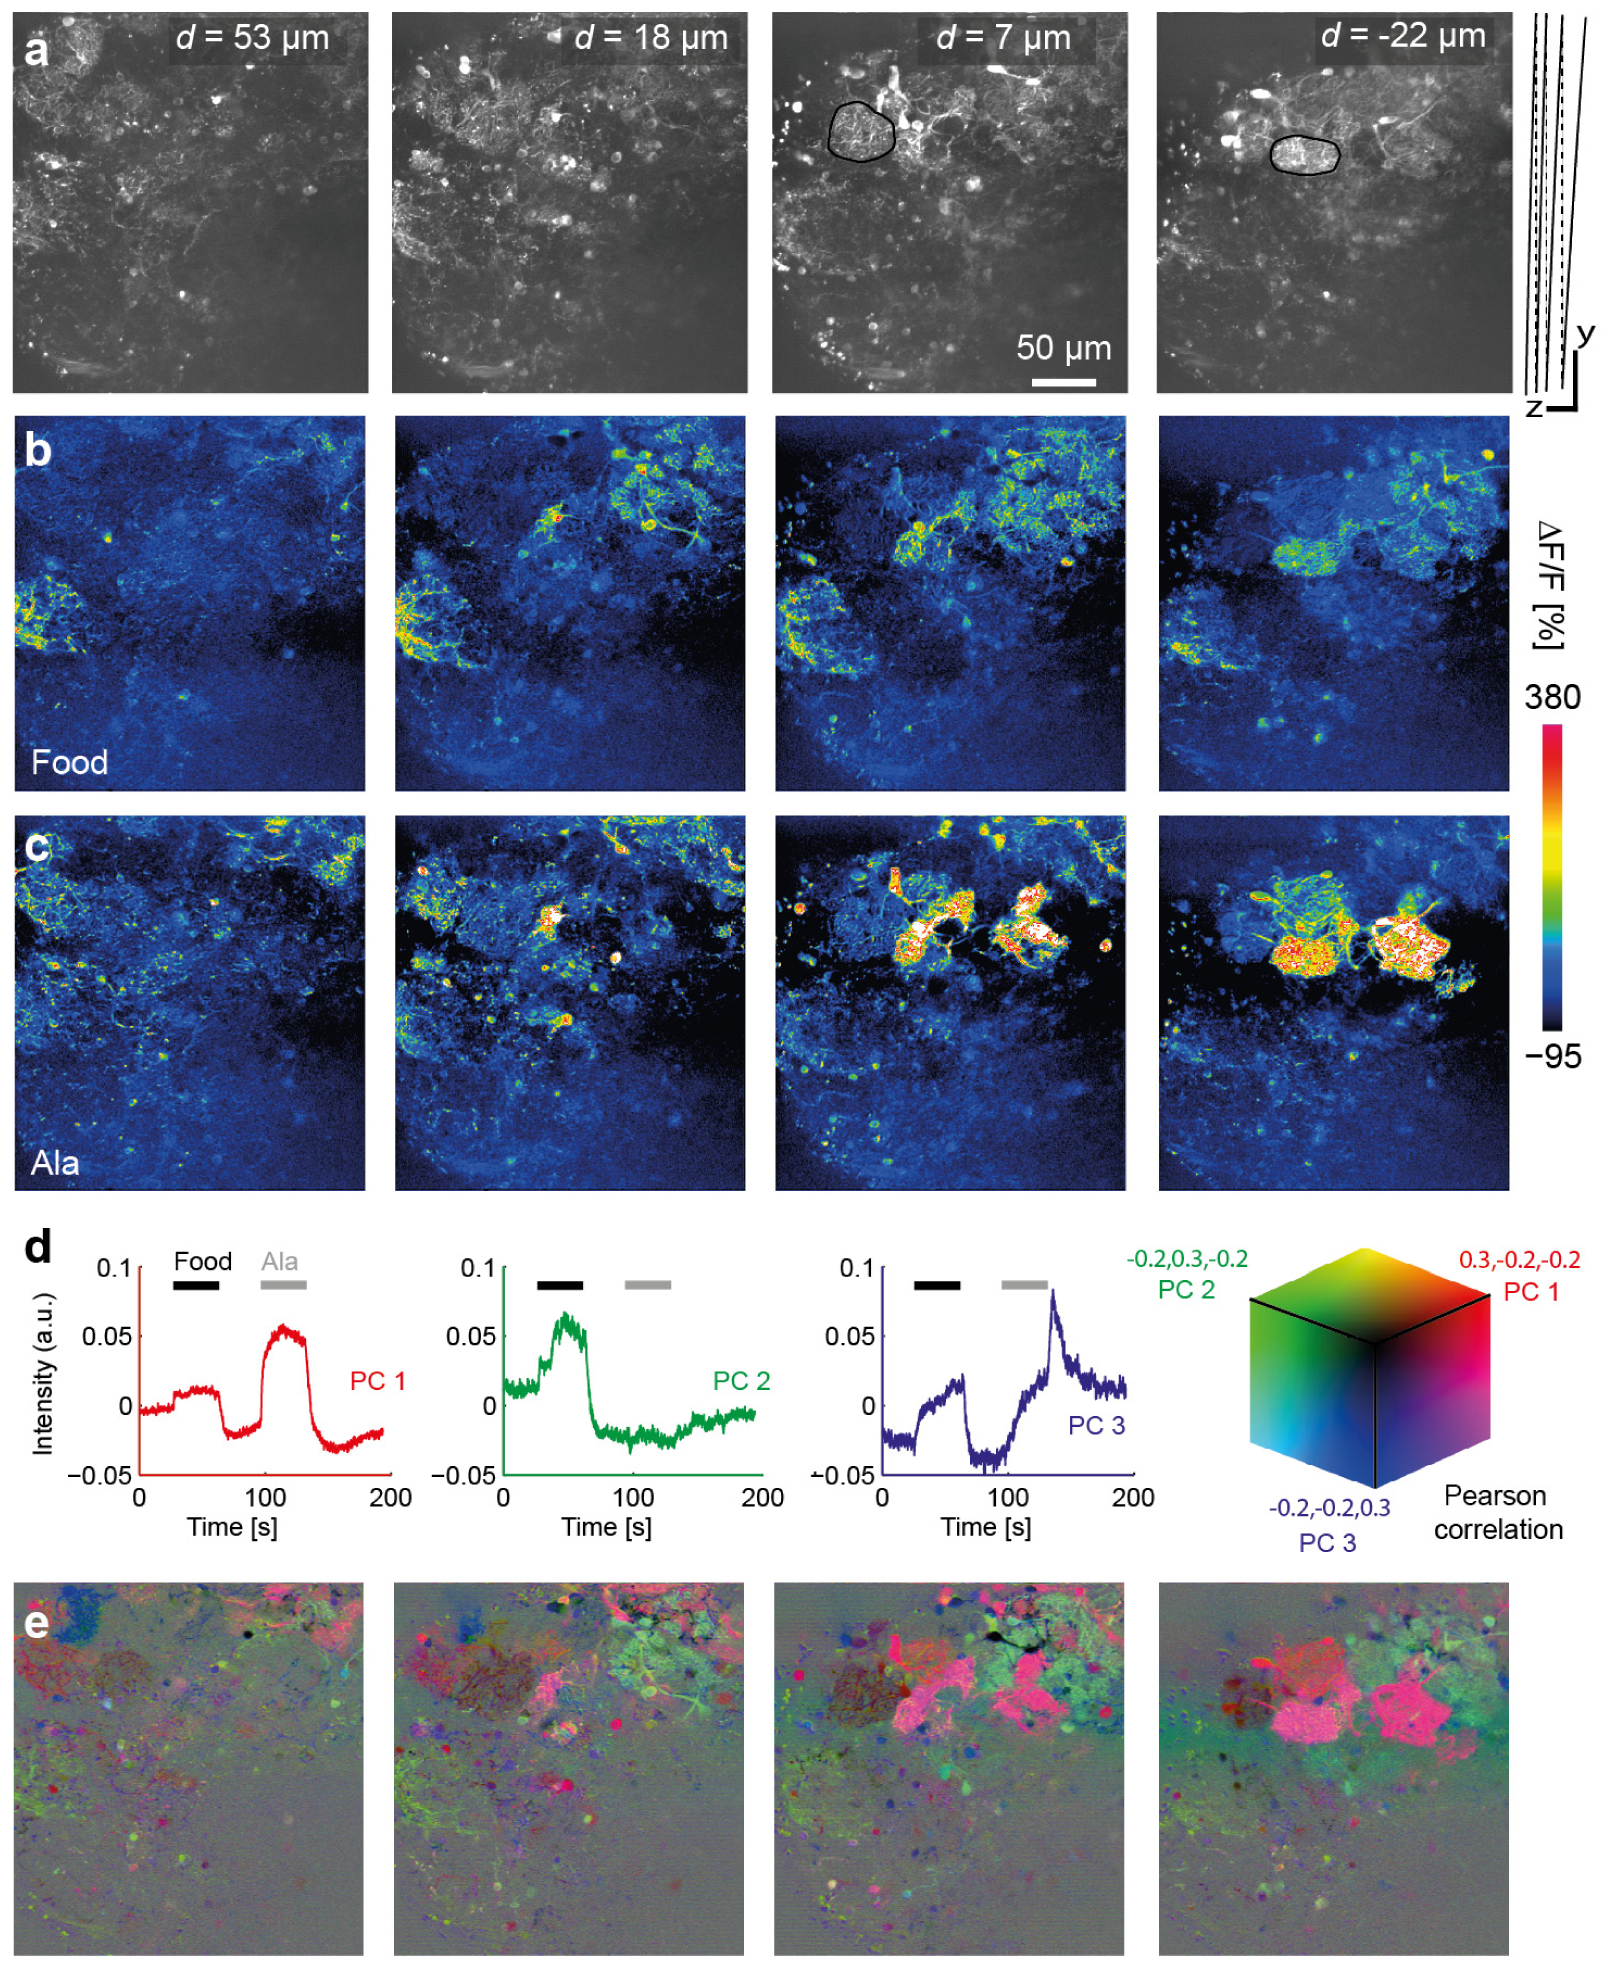
Fig. 5
Calcium imaging in the olfactory bulb using configuration 1. (a) Calcium indicator fluorescence (512 x 512 pixels) in four optical sections through the OB of an adult Tg(NeuroD:GcaMP6F)icm05 fish (see Visualization 1). Values of d show the displacement of the center of each image from the reference plane (no mirror displacement; D = 0 and d = 0). Raw fluorescence images were averaged over the full 200 s. Two glomerular structures are outlined in black. Right: scan trajectory in yz; both scalebars are 50 �m. (b,c) Relative change in fluorescence intensity during application of each odor (40 s). (d) Time courses of first three principal components (PC 1-3) (e) Correlation maps showing the correlation coefficient between the time course of each pixel and each PC. For each optical section, the correlation maps for each PC are combined into a single RGB image (see color cube).