
|
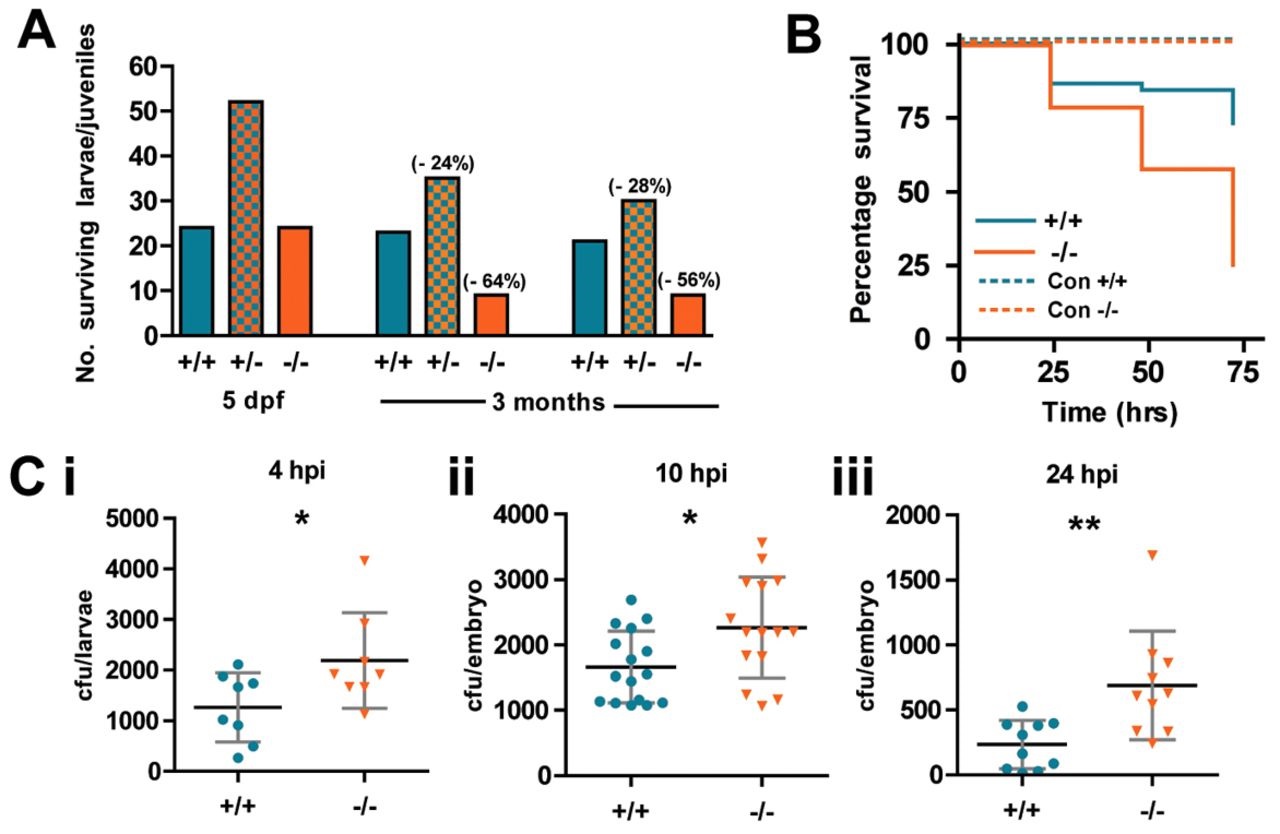
Fig. 3
WASp mutant larvae show increased susceptibility to death from bacterial infection. (A) Ratio of genotypes of the offspring from WASp heterozygous in-crossed adults at 5dpf and 3 months. Values in brackets indicate percentage drop in survival from predicted Mendelian ratio for WASp+/- and WASp-/- larvae. (B) Survival curves for WT (n = 44) versus mutant (n = 43) zebrafish larvae injected at 52hpf with S. aureus; control injection is with PBS, WT (n = 15) mutant (n = 18). (C) Colony-forming unit (cfu) counts of individual larvae injected with 1200cfu of S. aureus at (i) 4hours post injection (hpi), WT (n = 8), mutant (n = 8); (ii) 10hpi, WT (n = 16), mutant (n = 15); (iii) 24hpi, WT (n = 10), mutant (n = 10). Error bars (s.d); asterisks denote significance values of *P<0.05, **P<0.01 using Student′s t-test.