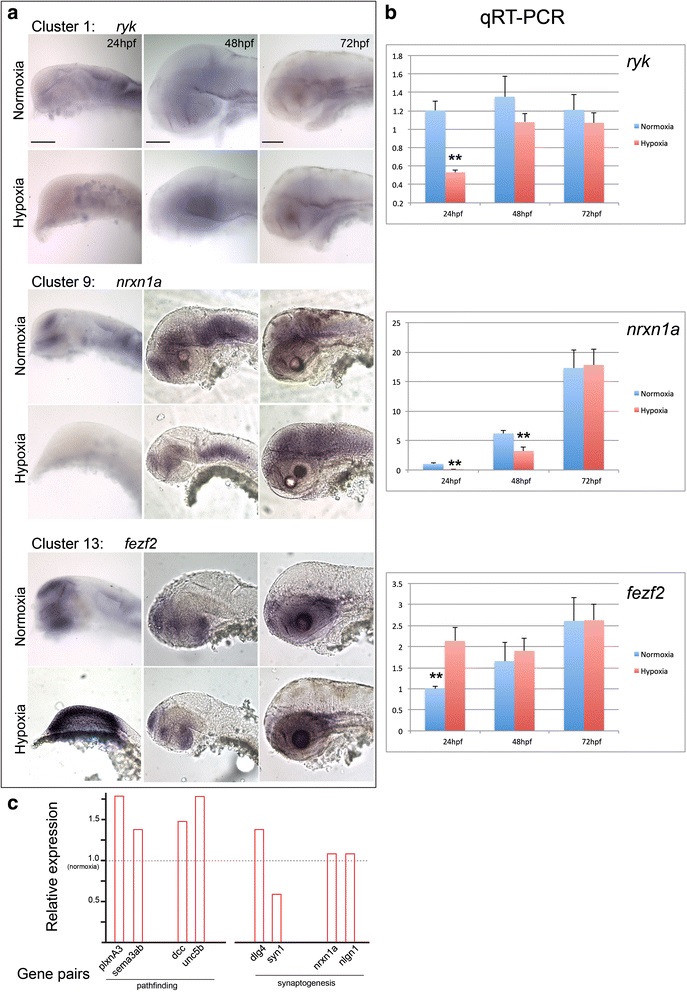
Fig. 6
in situ validation of RNAseq results, and schematic of hypoxia-associated dysynchrony. a Examples of gene expression changes across development, and hypoxia compared to normoxia. Clusters refer to K analysis, Fig. 4. Whole-mount in situ images for ryk, nrxn1a, and fezf2; lateral views, dorsal to top, rostral to left. Scale bar 50 µm. ryk expression is decreased in hypoxia at 24 hpf, but then is otherwise relatively invariant across development and in hypoxia compared to normoxia. nrxn1a and fezf2 also demonstrate dynamic changes in expression at different developmental stages, and in hypoxia/normoxia. b qRT-PCR results for ryk, nrxn1a, and fezf2; normalized to elfa with relative value set to “1” for 24 hpf normoxia. Error bars, standard deviation; two-way t test; ** p < 0.01. c Schematic of effects of hypoxia on disrupting normal connectivity gene expression interactions. Relative expression at 24 hpf is shown for axon pathfinding and at 72hpf for synaptogenesis. Normal/normoxic expression level is set at “1”; fold-change of gene expression following hypoxia is shown by the red bars. Two examples each of ligand/receptor gene pairs are shown for axon guidance; and two pairs of pre-/post-synaptic genes for synaptogenesis

