Fig. 6
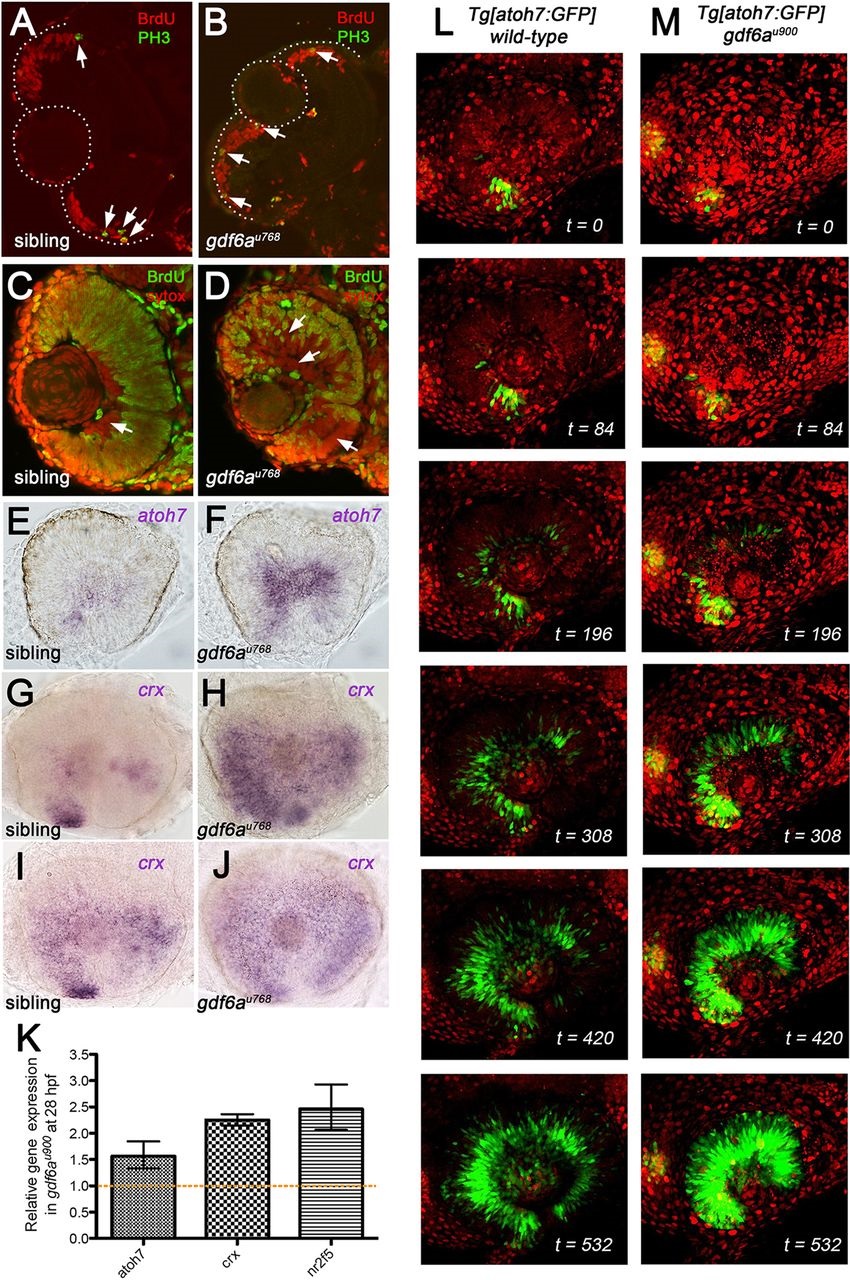
gdf6a mutant retinae exhibit accelerated differentiation of neurons. (A,B) Transverse cryosections of retinae from sibling (A) and gdf6au768 (B) embryos injected with BrdU twice at 56hpf, again at 58hpf, and then fixed at 60hpf and immunostained for markers of DNA replication (BrdU, red) and G2/M phase (PH3, green). Dashed lines demarcate the lens and retinal boundaries. White arrows point to double-labelled cells. (C,D) Transverse cryosections of retinae from sibling (C) and gdf6au768 (D) embryos injected with BrdU at 50hpf, fixed at 60hpf, and then immunostained for BrdU (green) and counterstained with SYTOX Orange (red). White arrows point to regions where neurons were postmitotic at the time of BrdU incubation; in the wild-type eye, these are restricted mostly to the RGC layer but are more widely present in the mutant eye. (E-J) Lateral view of whole-mount eyes from sibling and mutant embryos showing expression (purple) of atoh7 at 28hpf (E,F), and crx at 36hpf (G,H) and 48hpf (I,J). (K) Real-time PCR quantification of atoh7, crx and nr2f5 expression from 28hpf dissected mutant and wild-type retinas normalized to β-actin. Wild-type values for each gene were set to 1 and mutant fold changes were plotted relative to this value (±s.e.). (L,M) Maximum intensity projections at single time points from time-lapse analyses of the generation of Tg[atoh7:GFP]-positive RGCs in wild-type (L) and gdf6a mutant (M) eyes. Stacks (80µm) of 2-µm optical sections were captured every 18min for 9h from 28.5hpf (t=0). Nuclei are labelled with histone H2B-mcherry (red). See also Movies 1 and 2. Time (t) is in minutes.

