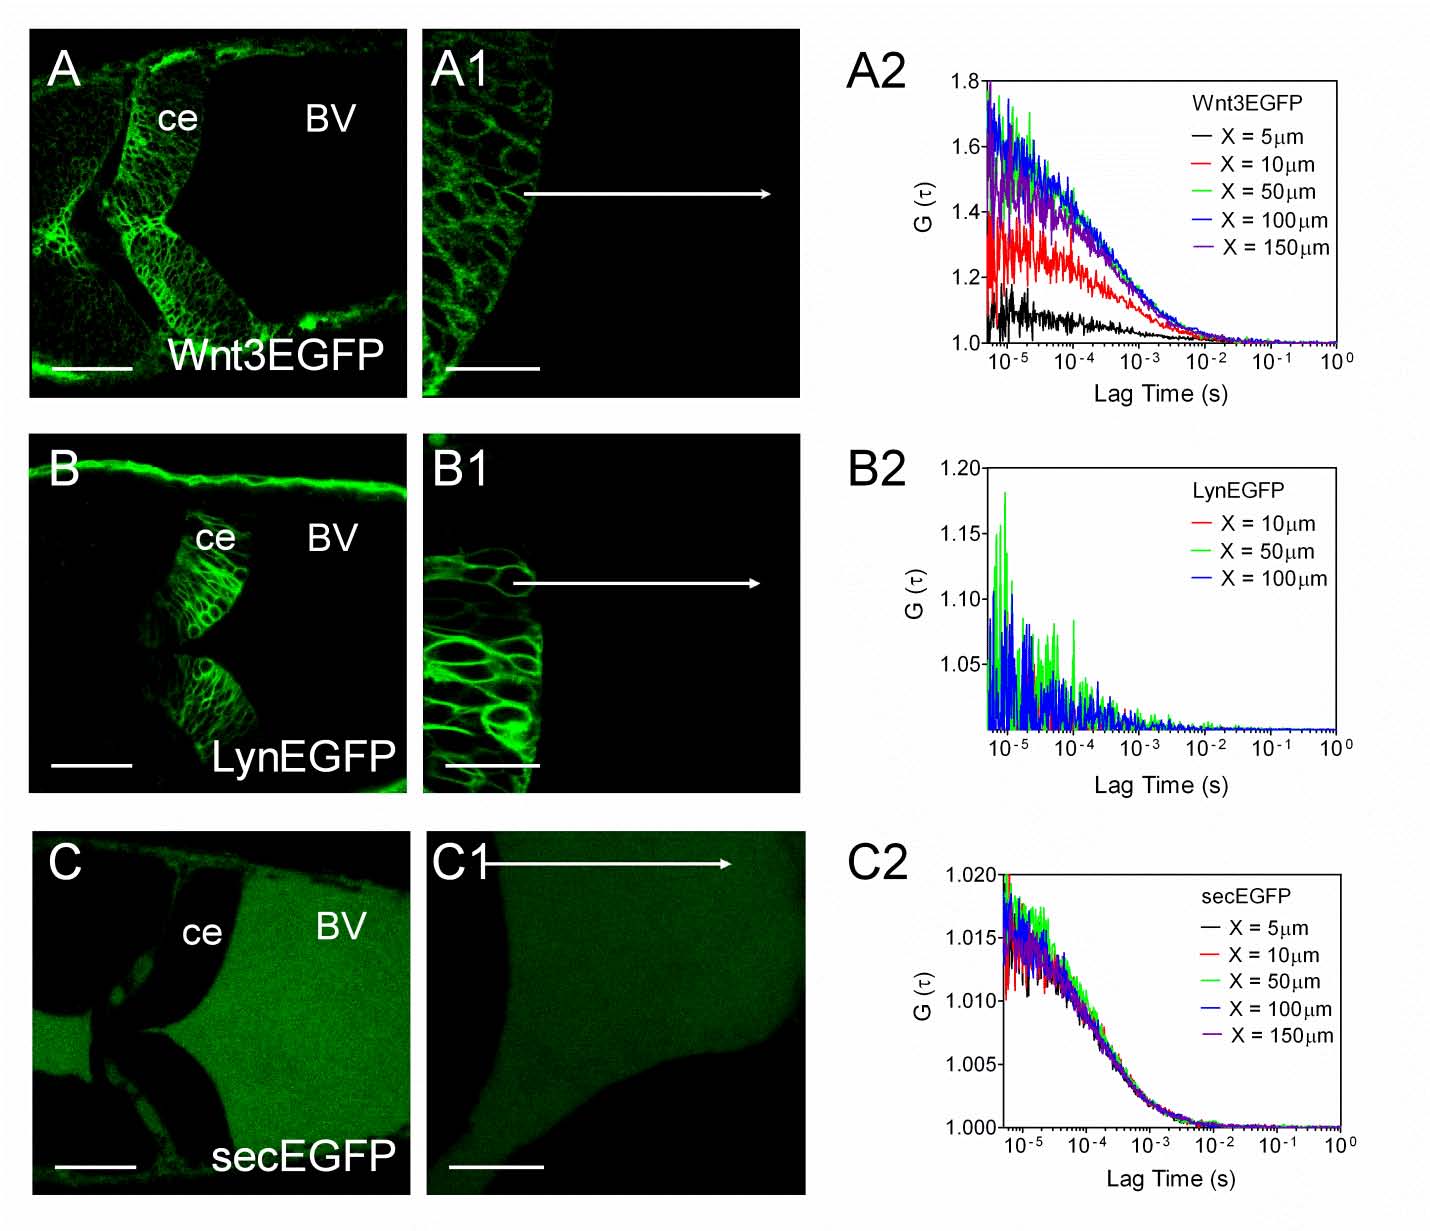
Fig. S6 Secreted Wnt3EGFP in the brain ventricle. (A, B, C) Confocal images of zebrafish cerebellum expressing Wnt3EGFP, LynEGFP and secEGFP at 34 hpf. Scale bar, 50 Ám. Images were taken in dorsal view. A is the same as Fig. 6A. (A1, B1, C1) Three times zoom in of (A, B, C) with focus on the boundary of the cerebellum and brain ventricle. Scale bar, 20 Ám. X-scanning was performed along the white arrow. Data were analysed using ImageJ. Results are shown in Fig. 6C in the main text. (A2, B2, C2) ACF curves of FCS measurements along the arrows at different distance from the cell boundary: 5Ám (black); 10Ám (red); 50Ám (green); 100Ám (blue); 150Ám (purple). FCS data at 100 Ám were normalized and plotted in Fig. 6D in the main text for comparison. Abbreviations: Ce: cerebellum; BV: brain ventricle.
Image
Figure Caption
Acknowledgments
This image is the copyrighted work of the attributed author or publisher, and
ZFIN has permission only to display this image to its users.
Additional permissions should be obtained from the applicable author or publisher of the image.
Full text @ Development

