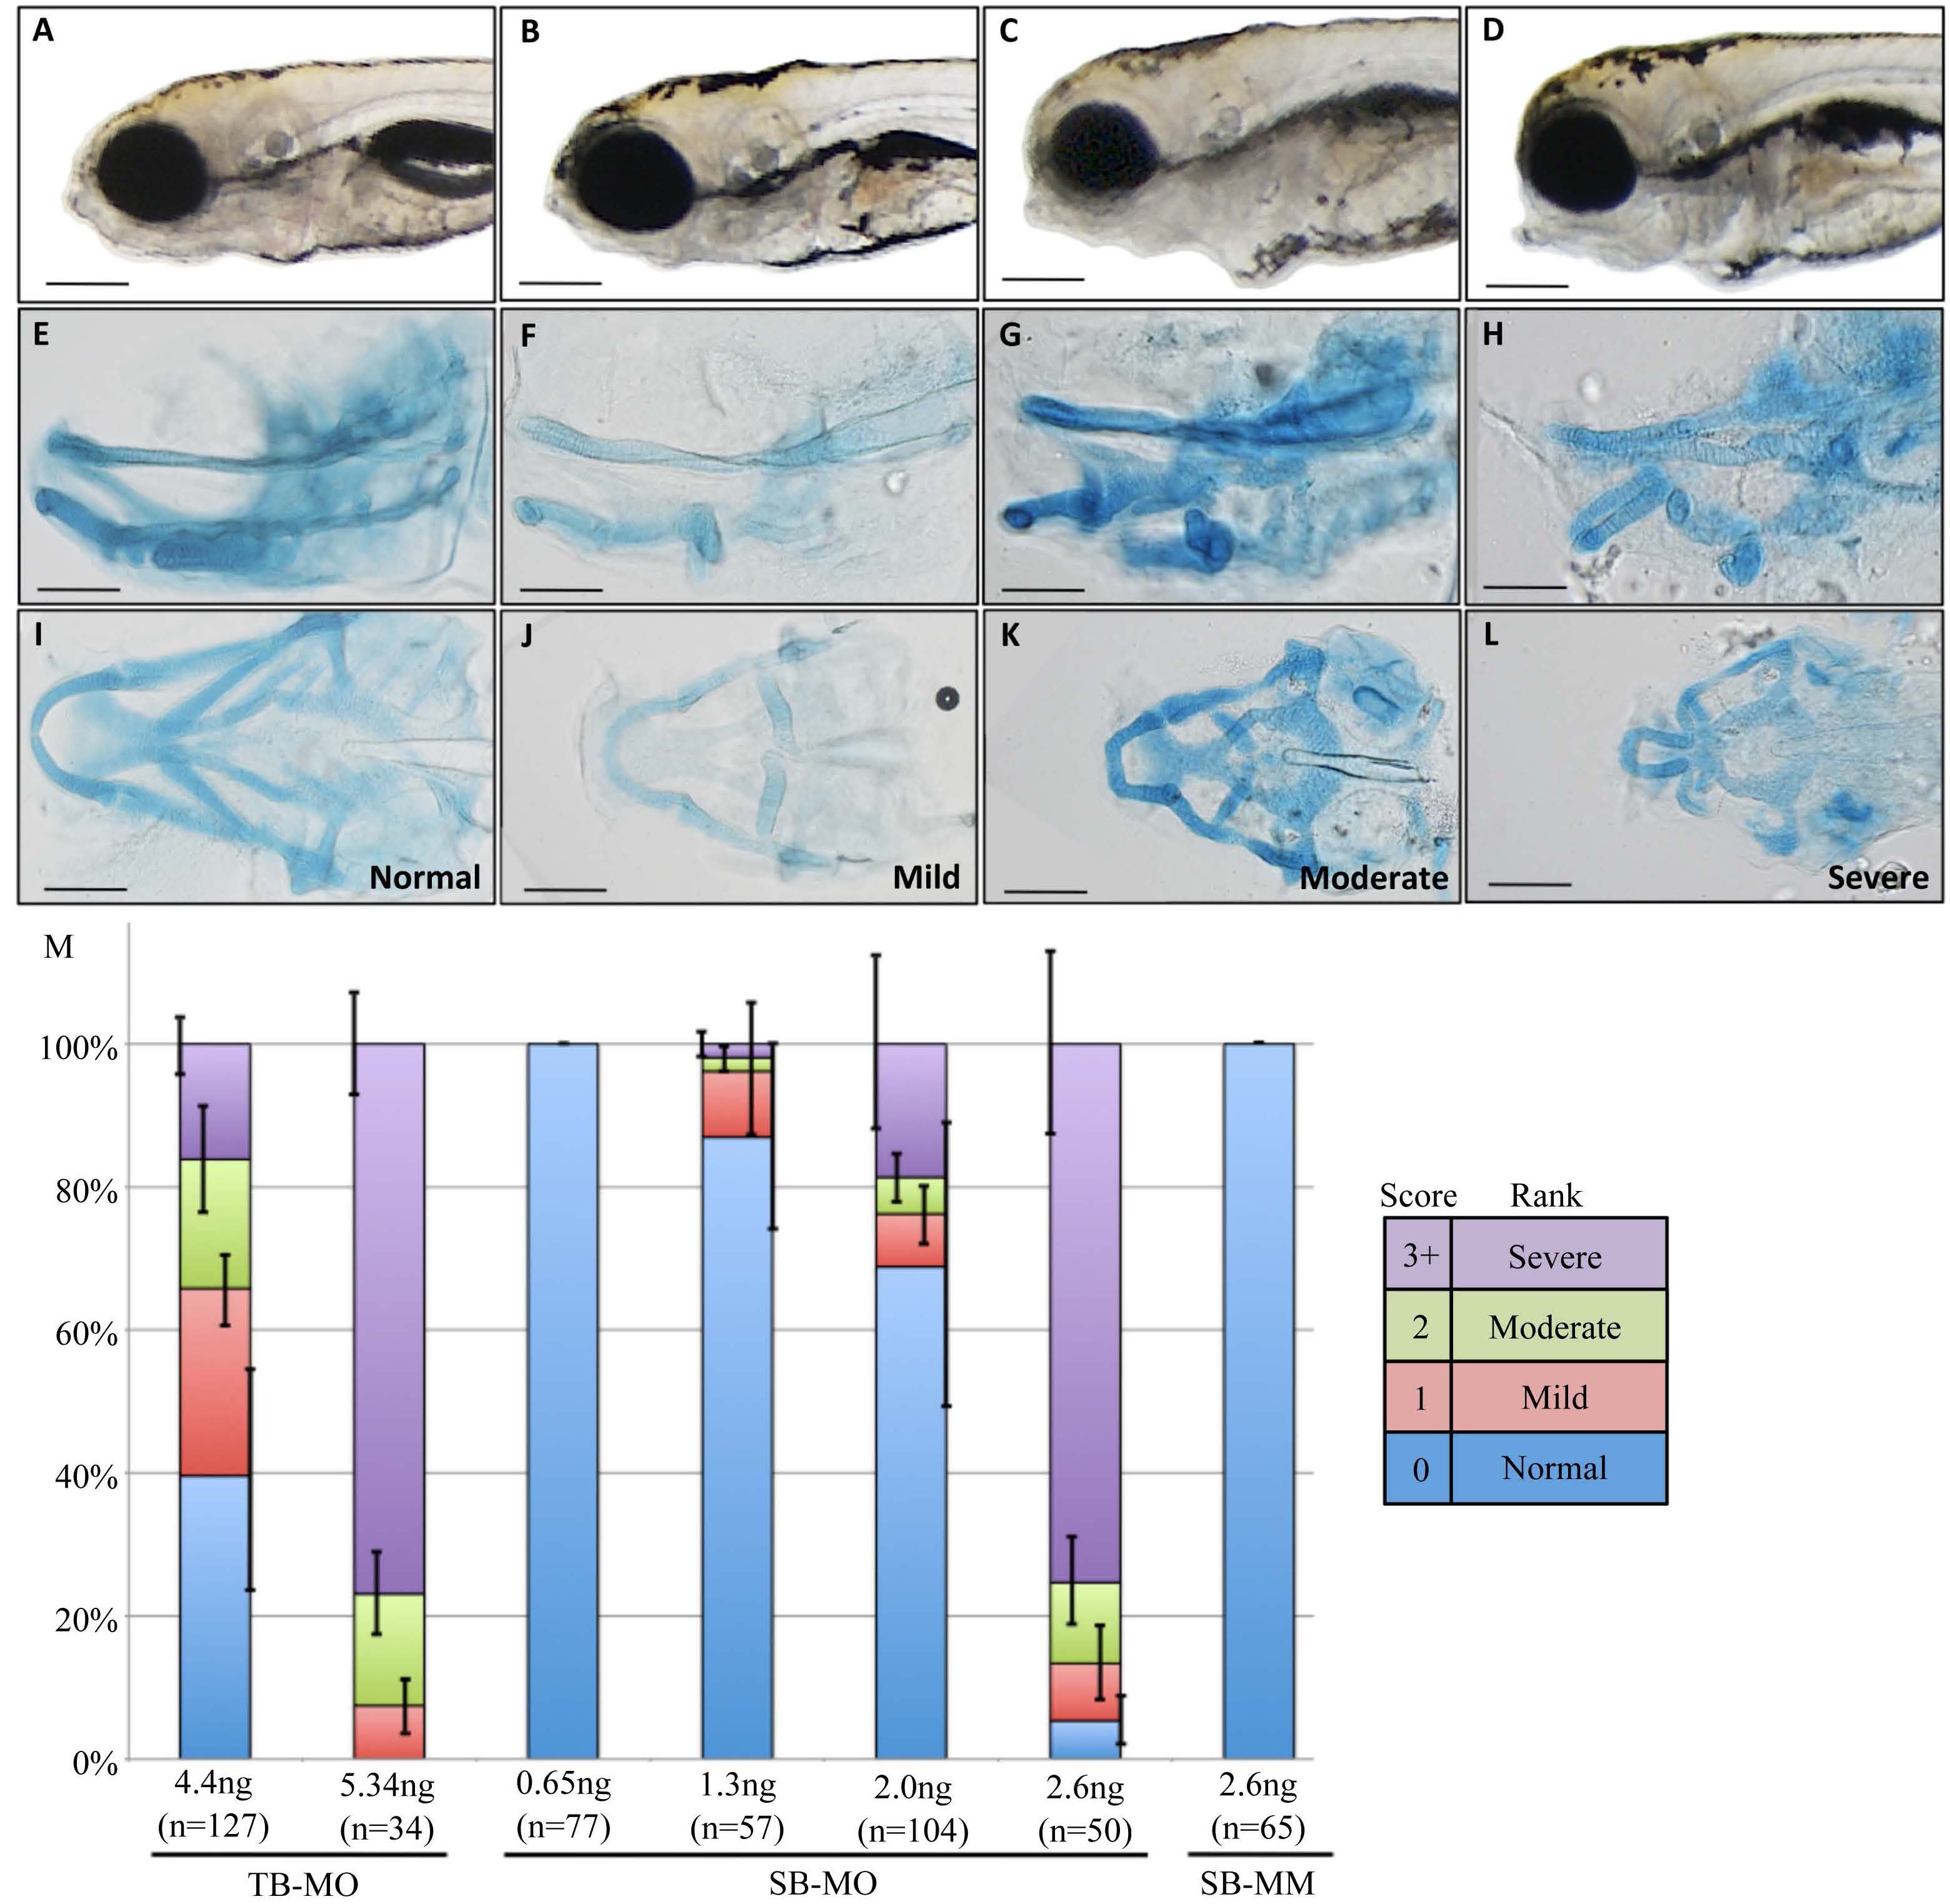
Fig. 1 Gross morphological phenotypes of 5dpf zebrafish after Wnt9b knockdown. 5dpf live (A)-(D) and Alcian blue stained (E)-(L) embryos, anterior to left, lateral view (A)-(H) and ventral view (I)-(L). Control embryos, injected with the five base mismatched splice blocking morpholino (SB-MM) are shown within the left most column (A), (E), (I) and are indistinguishable from uninjected controls. Splice blocking morpholino (SB-MO) injected embryos were scored as Mild (B), (F), (J), Moderate (C), (G), (K) or Severe (D), (H), (L) using an objective scoring method (see Supplemental Figure 1. for details) and are shown in subsequent columns. (M) Quantification of the proportion of embryos within each category. Translation blocking (TB-MO), splice blocking (SB-MO) and mismatch control (SB-MM) injected embryos were categorically scored at 5dpf. Injection dose is indicated in ng, and the total number (n) of embryos scored is listed. Note that 5.3 ng TB-MO and 2.6 ng SB-MO produce comparable proportions of affected embryos. Error bars are standard error of means of three biological replicates. Size bars in (A)-(L) are 250 um.
Image
Figure Caption
Figure Data
Acknowledgments
This image is the copyrighted work of the attributed author or publisher, and
ZFIN has permission only to display this image to its users.
Additional permissions should be obtained from the applicable author or publisher of the image.
Full text @ Am. J. of Molec. Bio.

