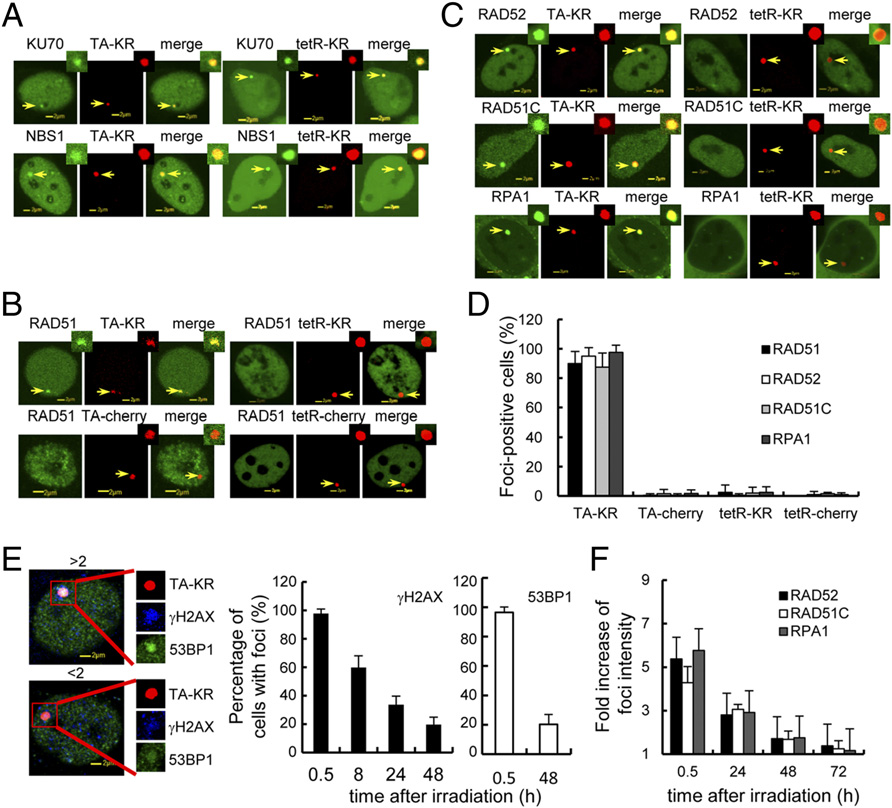
Fig. 2
HR factors are specifically recruited to transcriptionally active damage sites. (A) Recruitment of KU70 and NBS1 at TA-KR and tetR-KR damage sites is equal after damage. (B) RAD51 is specifically recruited to TA-KR but not TA-mCherry or tetR-KR/mCherry. U2OS TRE cells were illuminated with 15W cool fluorescent white light for 10 min for damage production. The recruitment of RAD51 stained with its Ab is shown 30 min after damage production. (C) GFP tagged RPA1, RAD52, and RAD51C are specifically recruited to TA-KR with the same treatment as in A. (D) Quantification of percentage of cells with positive foci of the HR factor at the indicated spot 30 min after damage production. Error bars indicate the SEM of three independent experiments, n = 100. (E) Percentage of cells with γH2AX and 53BP1 foci (defined as the fold increase of foci at TA-KR sites >2 compared with intensity of background in the same cell) at the indicated time points after damage induction. (F) Quantification of average fold increase of foci intensity (n = 10) of the HR factor at sites of TA-KR at the indicated recovery time after damage production. Error bars indicate the SEM of three independent experiments in E and F.

