
|
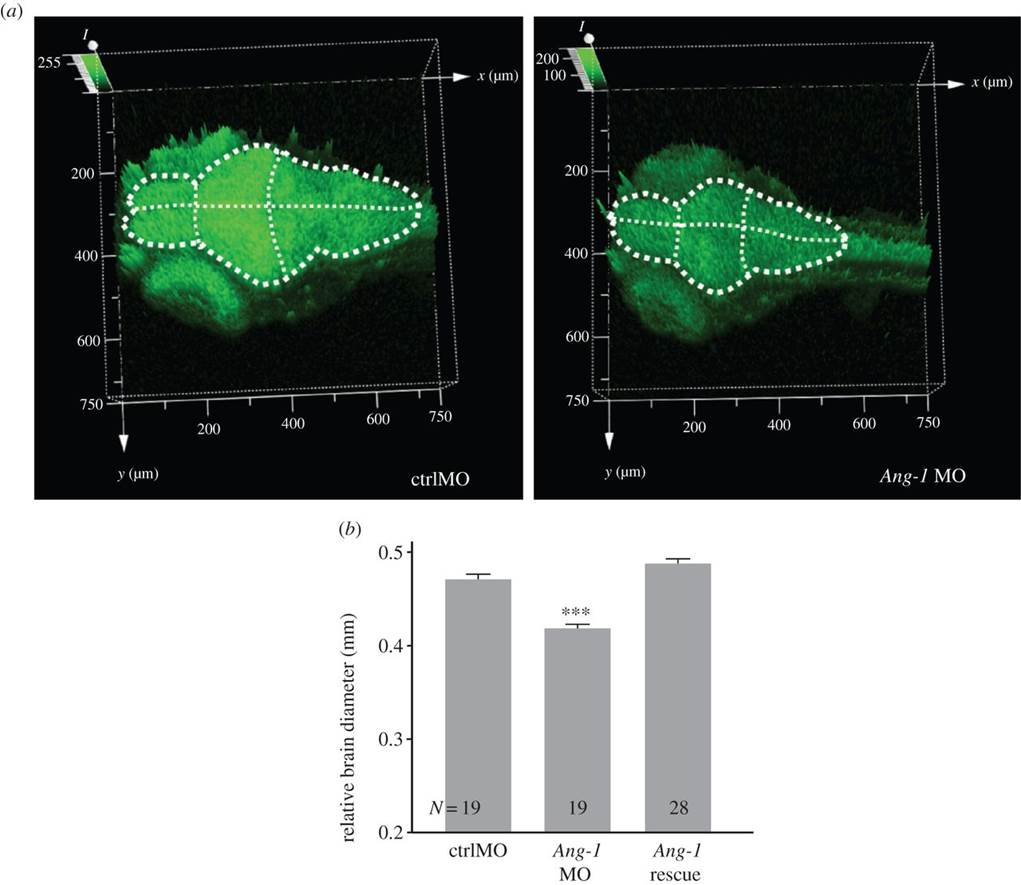
Fig. 2
Brain morphology of zebrafish Ang-1 morphant. (a) Knockdown of Ang-1 expression caused the small-sized brain and the reduction of GFP intensity in the Ang-1 morphant (Ang-1 MO) compared with the control group (ctrlMO) in the Tg (alpha-tubulin-GFP) background line at 4 dpf (n = 6). Dashed lines illustrate the brain area. (b) Ang-1 MO shows the significantly smaller relative brain diameter (controlled for body size) than the control and rescue group (ANCOVA: group: F2,62 = 74.55, p < 0.001, body length: F1,62 = 14.47, p < 0.001; post hoc pairwise group comparisons: ctrlMO versus Ang-1 MO: p < 0.001, ctrlMO versus Ang-1 rescue: p = 0.069, Ang-1 MO versus Ang-1 rescue: p < 0.001; ***p < 0.001).