Fig. 1
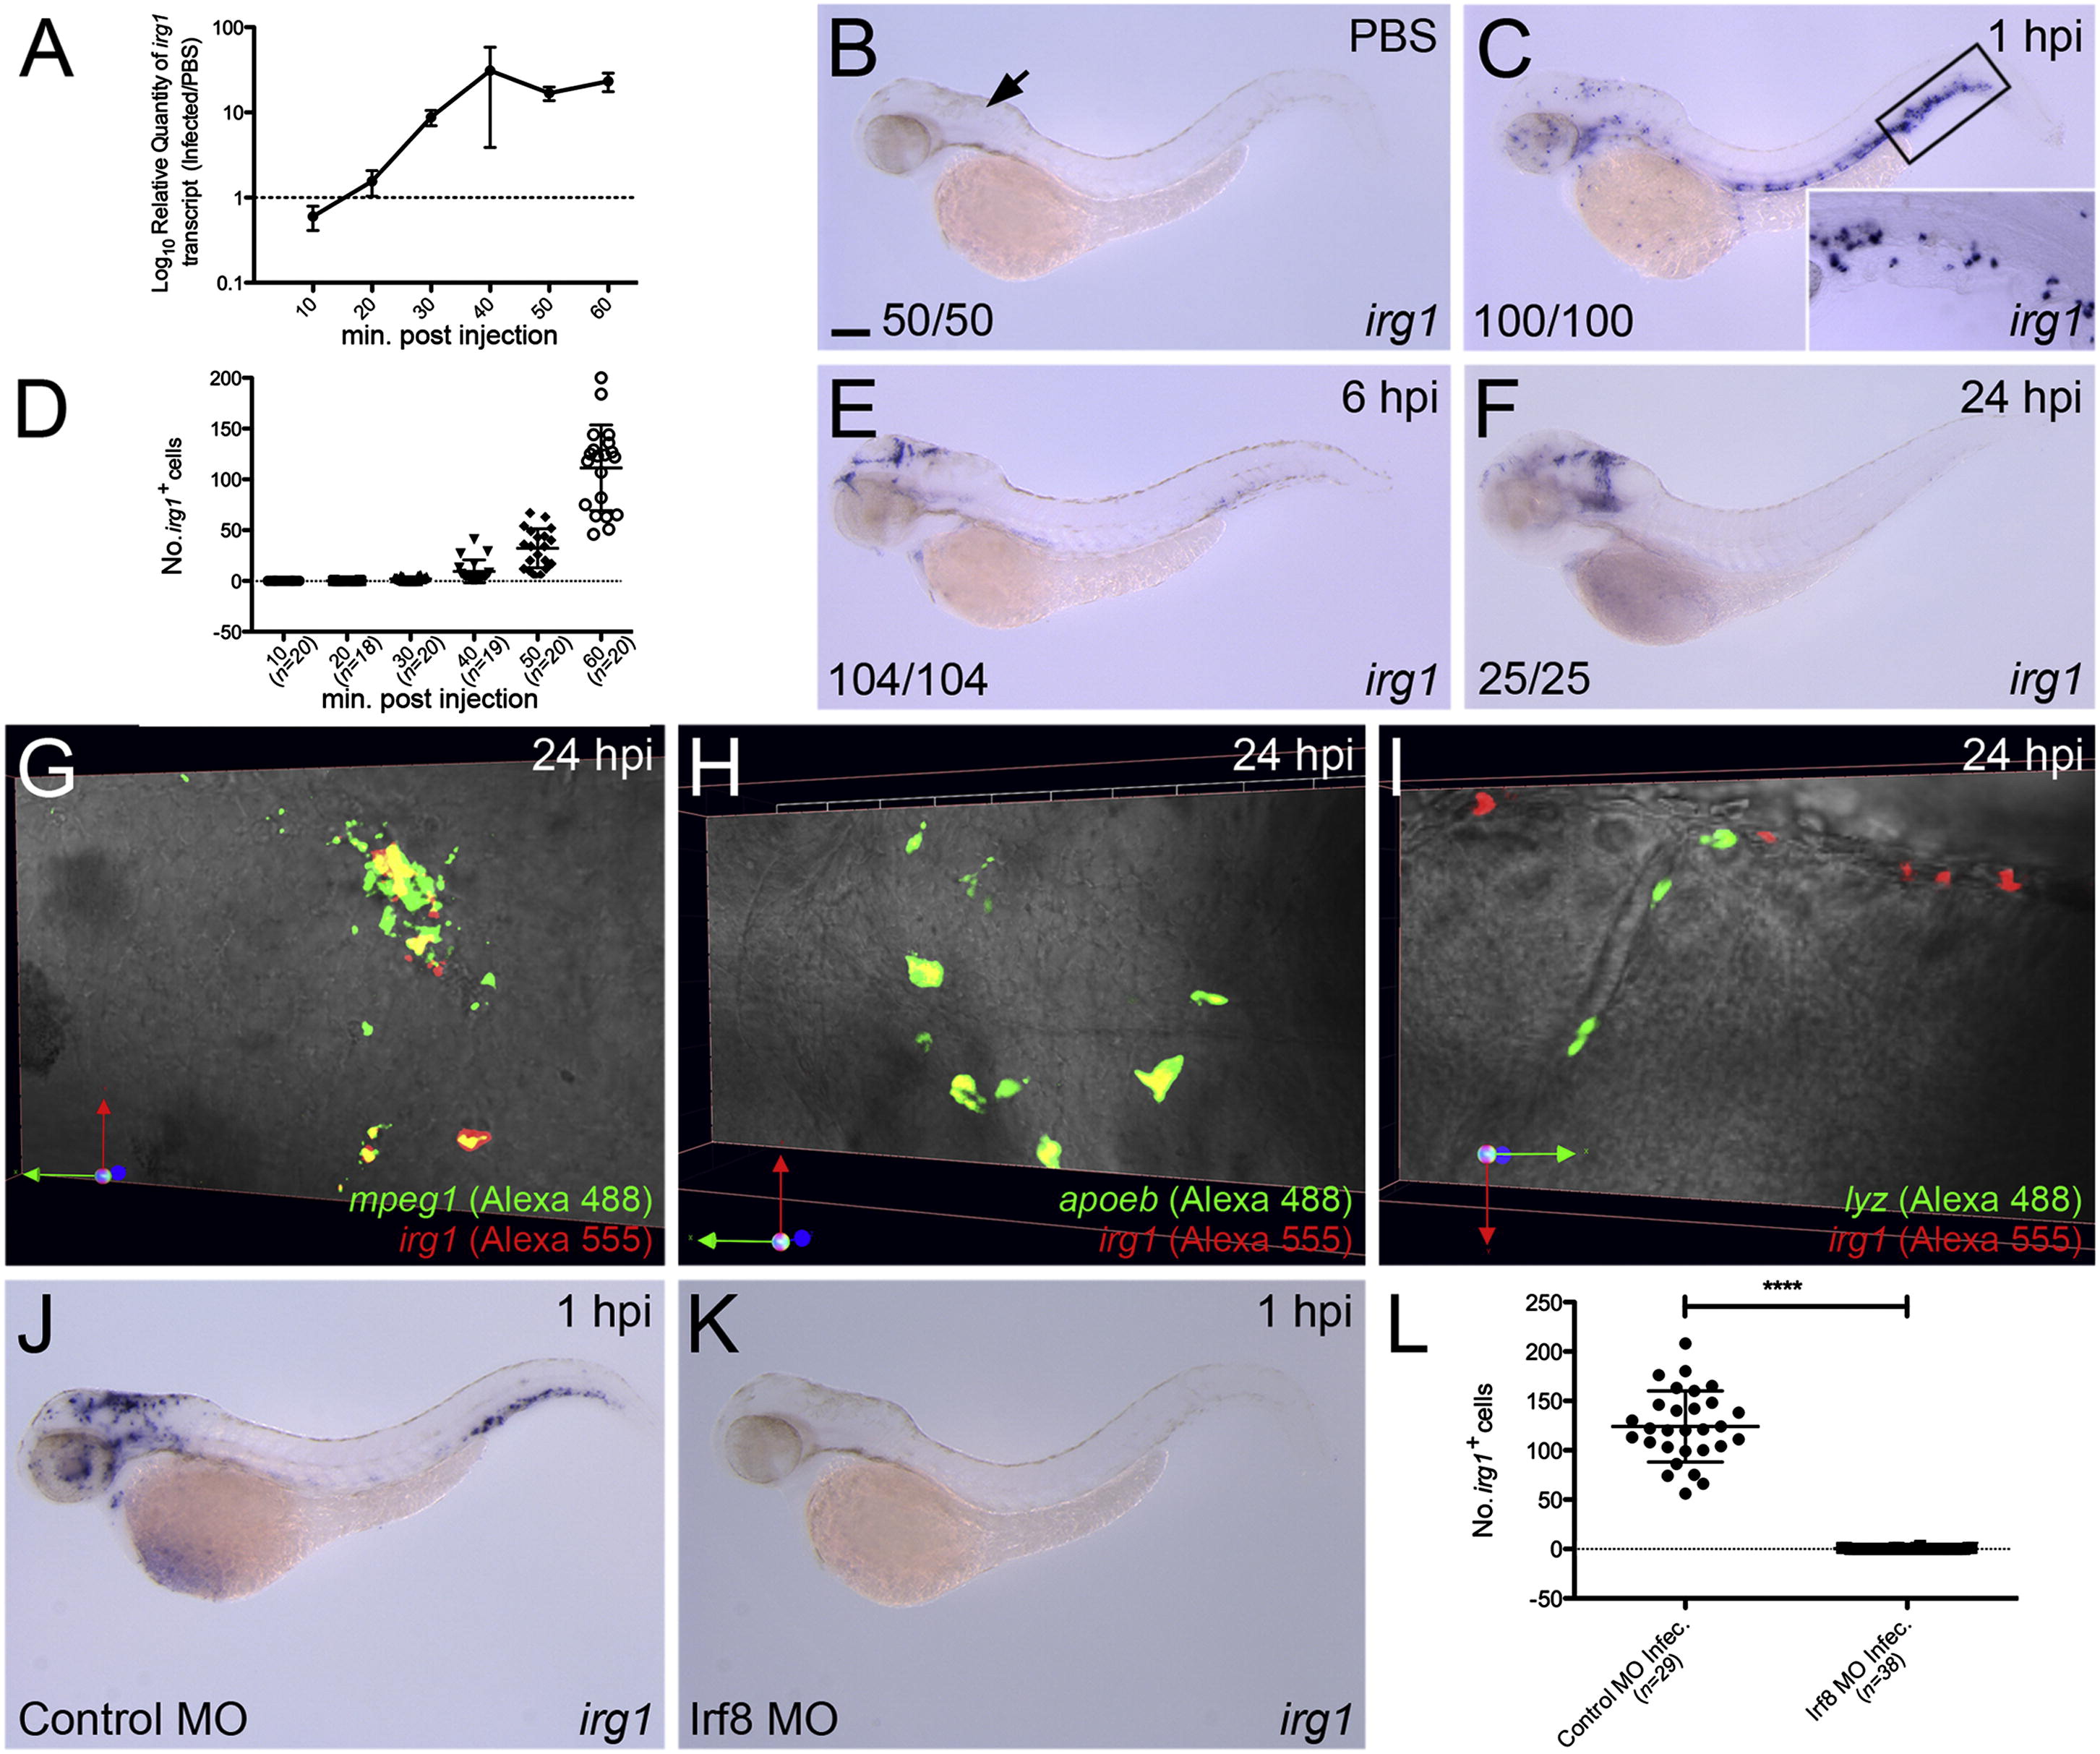
Macrophage-Lineage Cells Express irg1 in Response to Infection
(A) Temporal QPCR analysis of irg1 expression within infected larvae (relative to PBS-injected controls) throughout first hour of infection, n = 3 biological replicates (mean ± SD).
(B and C) Expression of irg1 within PBS-injected control and infected larvae at 1 hpi, respectively. Arrow marks hindbrain ventricle injection site. Inset, magnified view of boxed region of similarly treated larva (10× objective).
(D) Quantification of irg1+ cells within individual infected larvae at 10, 20, 30, 40, 50, and 60 mpi (mean ± SD).
(E and F) Expression of irg1 within infected larvae at 6 and 24 hpi, respectively.
(G–I) Dual expression analysis of irg1 and mpeg1 (G), apoeb (H), and lyz (I) within the midbrain/hindbrain region of infected larvae at 24 hpi.
(J and K) Expression of irg1 within infected control MO-injected and Irf8-depleted larvae, respectively, at 1 hpi.
(L) Quantification of irg1+ cells within individual infected larvae as shown in (J) and (K) (mean ± SD). All views anterior to left. Numbers represent frequency of larvae with displayed phenotype. Scale bar, 100 µm in (B). p < 0.0001. See also Figure S1.
Reprinted from Cell Metabolism, 18(2), Hall, C.J., Boyle, R.H., Astin, J.W., Flores, M.V., Oehlers, S.H., Sanderson, L.E., Ellett, F., Lieschke, G.J., Crosier, K.E., and Crosier, P.S., Immunoresponsive Gene 1 Augments Bactericidal Activity of Macrophage-Lineage Cells by Regulating β-Oxidation-Dependent Mitochondrial ROS Production, 265-278, Copyright (2013) with permission from Elsevier. Full text @ Cell Metab.

