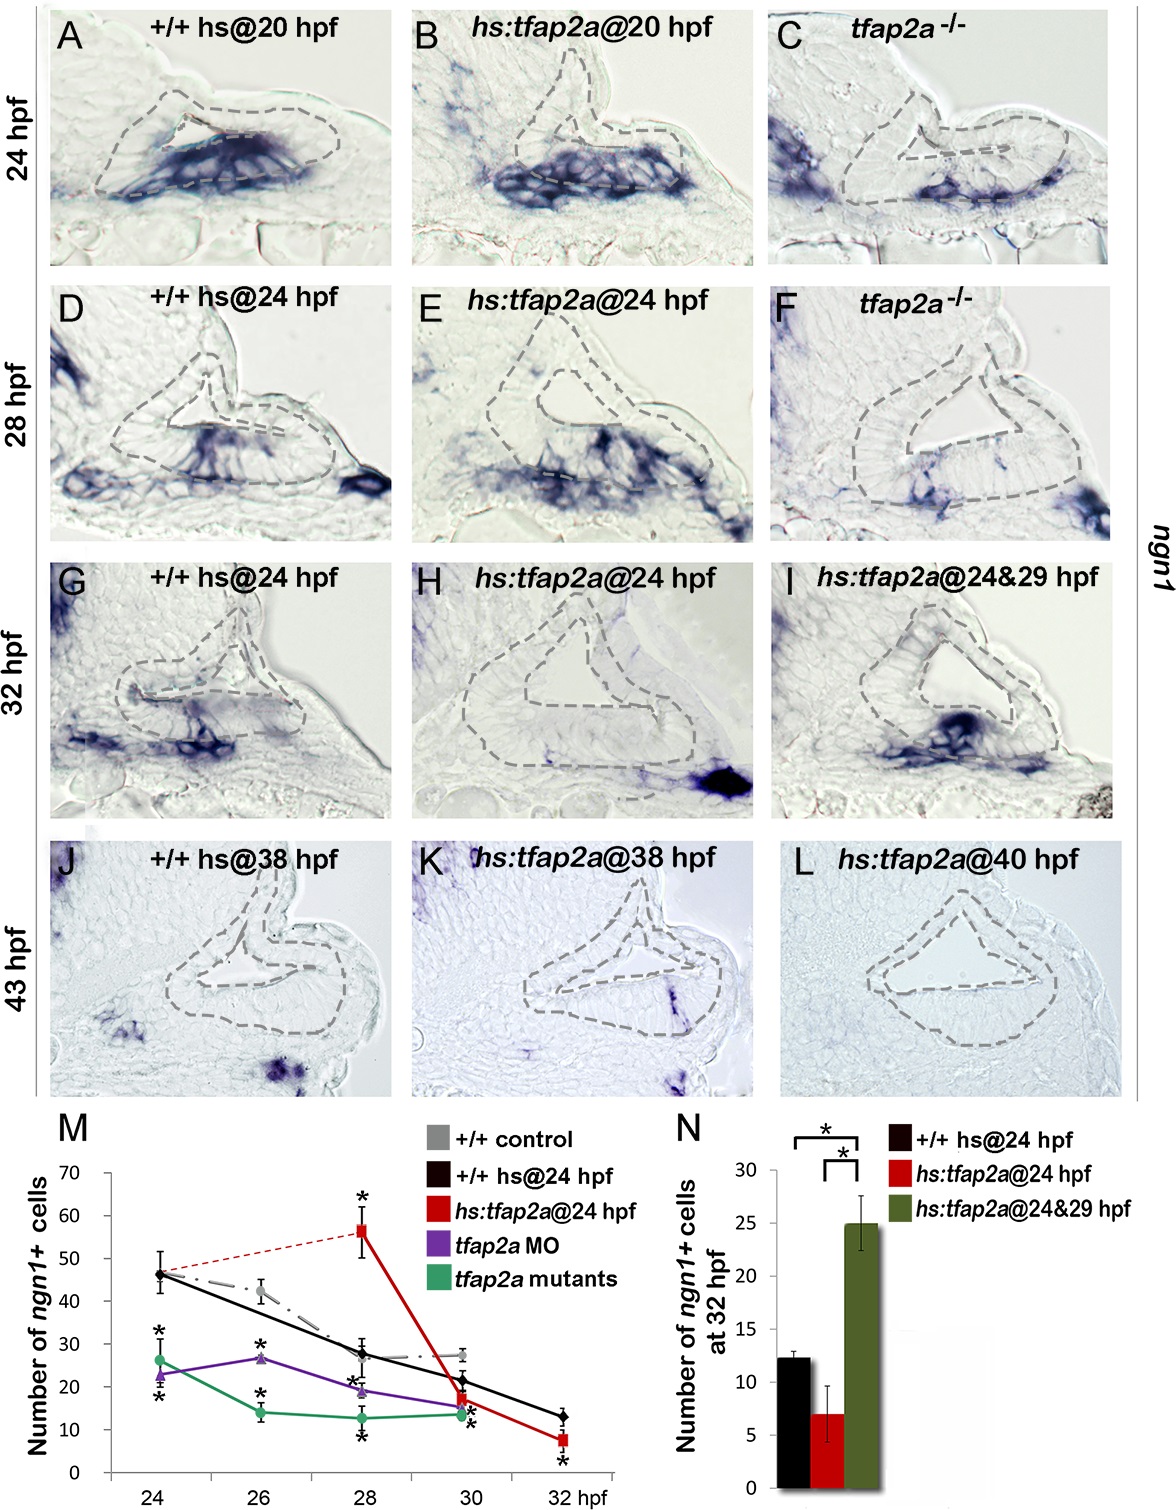
Fig. 2 Tfap2a enhances otic neurogenesis.
(A-L) Cross-sections (medial left, dorsal up) through the otic region just posterior to the utricular macula showing ngn1 expression in +/+ control embryos, hs:tfap2a embryos and tfap2a-/- mutants at the indicated times. Wild-type and hs:tfap2a embryos were heat shocked as indicated in each panel. Overexpression of tfap2a increases the number of neuroblasts in the otic vesicle whereas loss of tfap2a slows down and decreases otic neurogenesis. The outer and inner edges of the otic vesicle are outlined in each image. (M, N) Mean and standard deviation of the total number of ngn1 positive cells in the otic epithelium from 24 to 32 hpf for the genotypes indicated in the color key (counted from serial sections, n = 3?7 ears per time point). Asterisks (*) indicate statistically significant differences between groups indicated by brackets (N) or compared to control embryos (M).

