IMAGE
Fig. 2
Image
Figure Caption
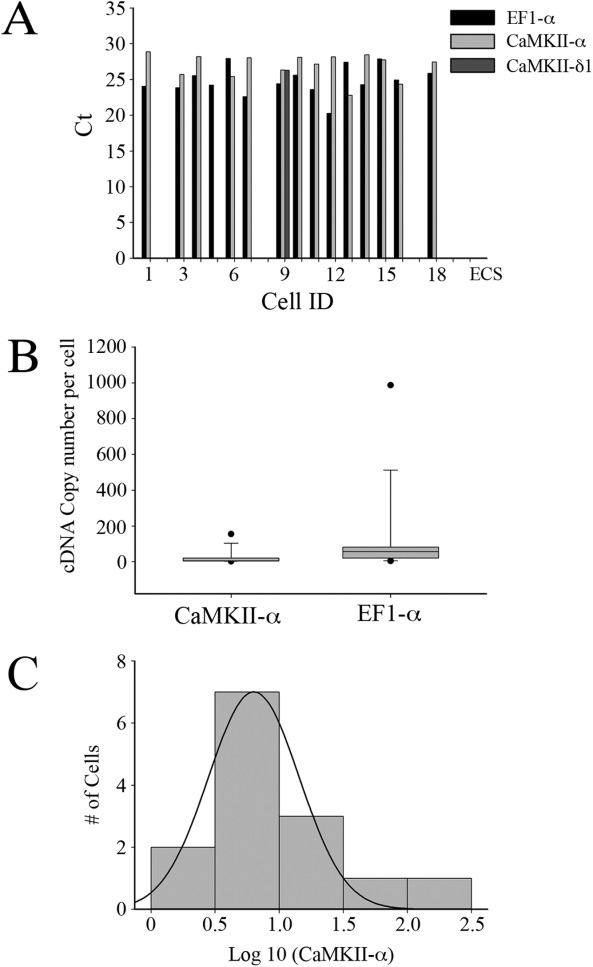
Fig. 2 Zebrafish M-cells express CaMKII-α. (A) Ct values of genes expressed in individual M-cell. An arbitrary Ct value of 0 was assigned when any particular gene was undetectable. Note that only one cell (ID: 9) expressed CaMKII-δ1 at detectable level. The control sample consisted of extracellular fluid (ECS) taken from a region surrounding the M-cell. (B) Box plot of quantified copy number of CaMKII-α and EF1-α in single M-cells. The median and 10, 25, 75, and 90 percentiles are plotted. (C) Log-normal distribution of CaMKII-α cDNA.
Figure Data
Acknowledgments
This image is the copyrighted work of the attributed author or publisher, and
ZFIN has permission only to display this image to its users.
Additional permissions should be obtained from the applicable author or publisher of the image.
Full text @ Dev. Neurobiol.

