Image
Figure Caption
Fig. 3
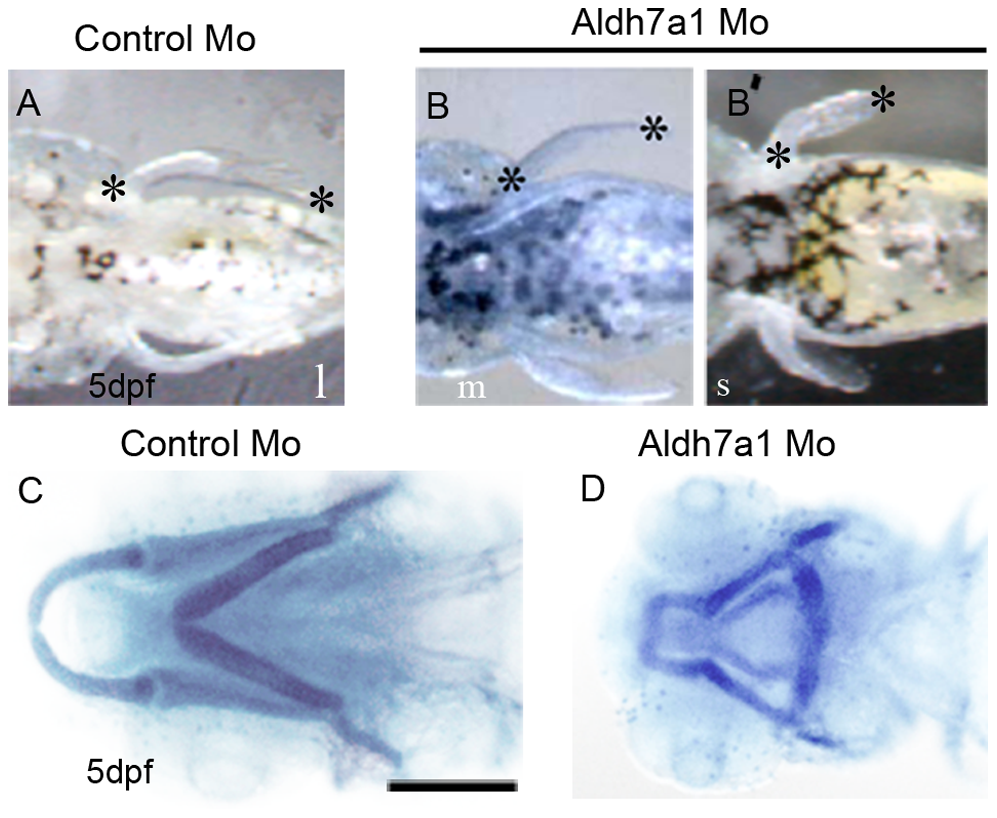
Aldh7a1 morpholino knockdown embryos show defects in pectoral fin and cartilage development.
(A–B2) Fin phenotypes long (l), medium (m), and short (s) classified by length at 5 dpf, marked by black asterisks. All control MO embryos displayed “Long” fins (A) and Aldh7a1MO injected embryos develop medium (B, 6%) or short (B2, 10%) fin. (C–D) Ventral view of Alcian blue staining of jaw- cartilages in control MO (C) and aldh7a1morphant (D) embryos. Scale bar: 350 μm in A–B2 125 μm in C,D.
Figure Data
Acknowledgments
This image is the copyrighted work of the attributed author or publisher, and
ZFIN has permission only to display this image to its users.
Additional permissions should be obtained from the applicable author or publisher of the image.
Full text @ PLoS One

