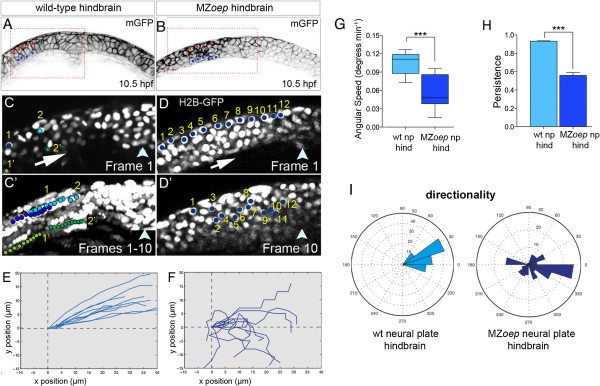
Fig. 7 Disrupted cell movements in MZoep neural plate. (A,B) Transverse confocal sections of neural plates at hindbrain level in wild-type and MZoep embryo at 10.5 hpf. Cell outlines revealed by membrane-GFP (black). (C) Frame 1 from a ten-frame time-lapse sequence at level of wild-type hindbrain. Blue nuclei labeled 1 and 2 are in the superficial layer of the neural plate, and green nuclei labeled 1? and 2? are in the deep layer of the neural plate. (C′) Superimposition of all ten frames from ten-frame time-lapse sequence. Superficial blue nuclei remain superficial and deep green nuclei remain deep in the converging neural plate. (D) Frame 1 from a ten-frame time-lapse sequence at level of hindbrain in MZoep embryo. Twelve nuclei in the superficial layer of the neural plate are marked with blue dots. (D′) Position of the 12 nuclei after ten frames shows nuclei are unable to maintain their superficial location in MZoep neural plate. (E) Trajectories of neural nuclei in wild-type embryos at hindbrain level. (F) Trajectories of neural nuclei at hindbrain level in MZoep embryos. (G) Angular speed is significantly reduced in MZoep neural plates (wild-type cells 0.11 degrees/min versus MZoep cells 0.04 degrees/min, ***P <0.0002 Student?s t-test). (H) Persistence is significantly reduced in MZoep neural plates (wild-type cells 0.92 versus MZoep cells 0.56, ***P <0.0001 Student?s t-test). (I) Directionality plots for cells in wild-type and MZoep neural plates. GFP, green fluorescent protein; hpf, hours post fertilization; MZoep, maternal-zygotic one-eyed pinhead; np, neural plate; wt, wild-type.
Image
Figure Caption
Figure Data
Acknowledgments
This image is the copyrighted work of the attributed author or publisher, and
ZFIN has permission only to display this image to its users.
Additional permissions should be obtained from the applicable author or publisher of the image.
Full text @ Neural Dev.

