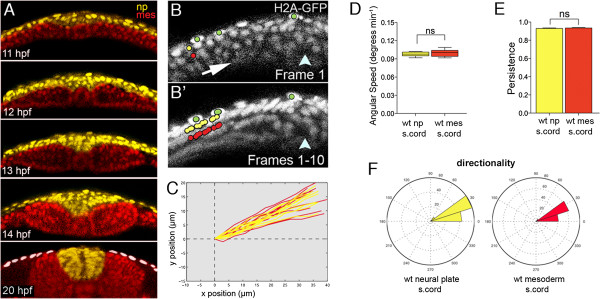
Fig. 6 Neural plate and mesoderm move closely together in early stages of zebrafish neurulation. (A) Five frames from a time-lapse movie showing relative organization of mesoderm and neural tissue during neurulation. Mesodermal nuclei are pseudocolored red and neural nuclei are pseudocolored yellow. Tissues remain closely apposed throughout convergence and internalization. White dots indicate the enveloping layer. (B) Frame 1 from a ten-frame time-lapse sequence at level of spinal cord in a wild-type embryo previously injected with H2B-RFP mRNA (gray). Only the left side of the neural plate is shown. Arrow indicates hypothetical tissue movements and arrowhead indicates position of the embryonic midline. Neural cell nuclei marked with yellow dot. Mesoderm cell nuclei marked with red dot. Enveloping layer cell nuclei marked with green dots. (B′) Superimposition of all ten frames from ten-frame time-lapse sequence. The yellow neural nucleus and the red mesodermal nucleus move closely together and in parallel. The green enveloping layer nuclei remain largely immobile. (C) Trajectories of neural (yellow) and mesodermal (red) nuclei in wild-type embryos at spinal cord level. (D) Analysis of angular speeds show neural plate and adjacent mesoderm move with near identical speeds. (E) Analysis of the persistence of movements show neural plate and adjacent mesoderm move with identical persistence. (F) Directionality plots for neural plate and adjacent mesoderm cells are nearly identical. H2B-RFP, histone H2B/red fluorescent protein fusion; wt, wild-type.
Image
Figure Caption
Figure Data
Acknowledgments
This image is the copyrighted work of the attributed author or publisher, and
ZFIN has permission only to display this image to its users.
Additional permissions should be obtained from the applicable author or publisher of the image.
Full text @ Neural Dev.

