Fig. 1
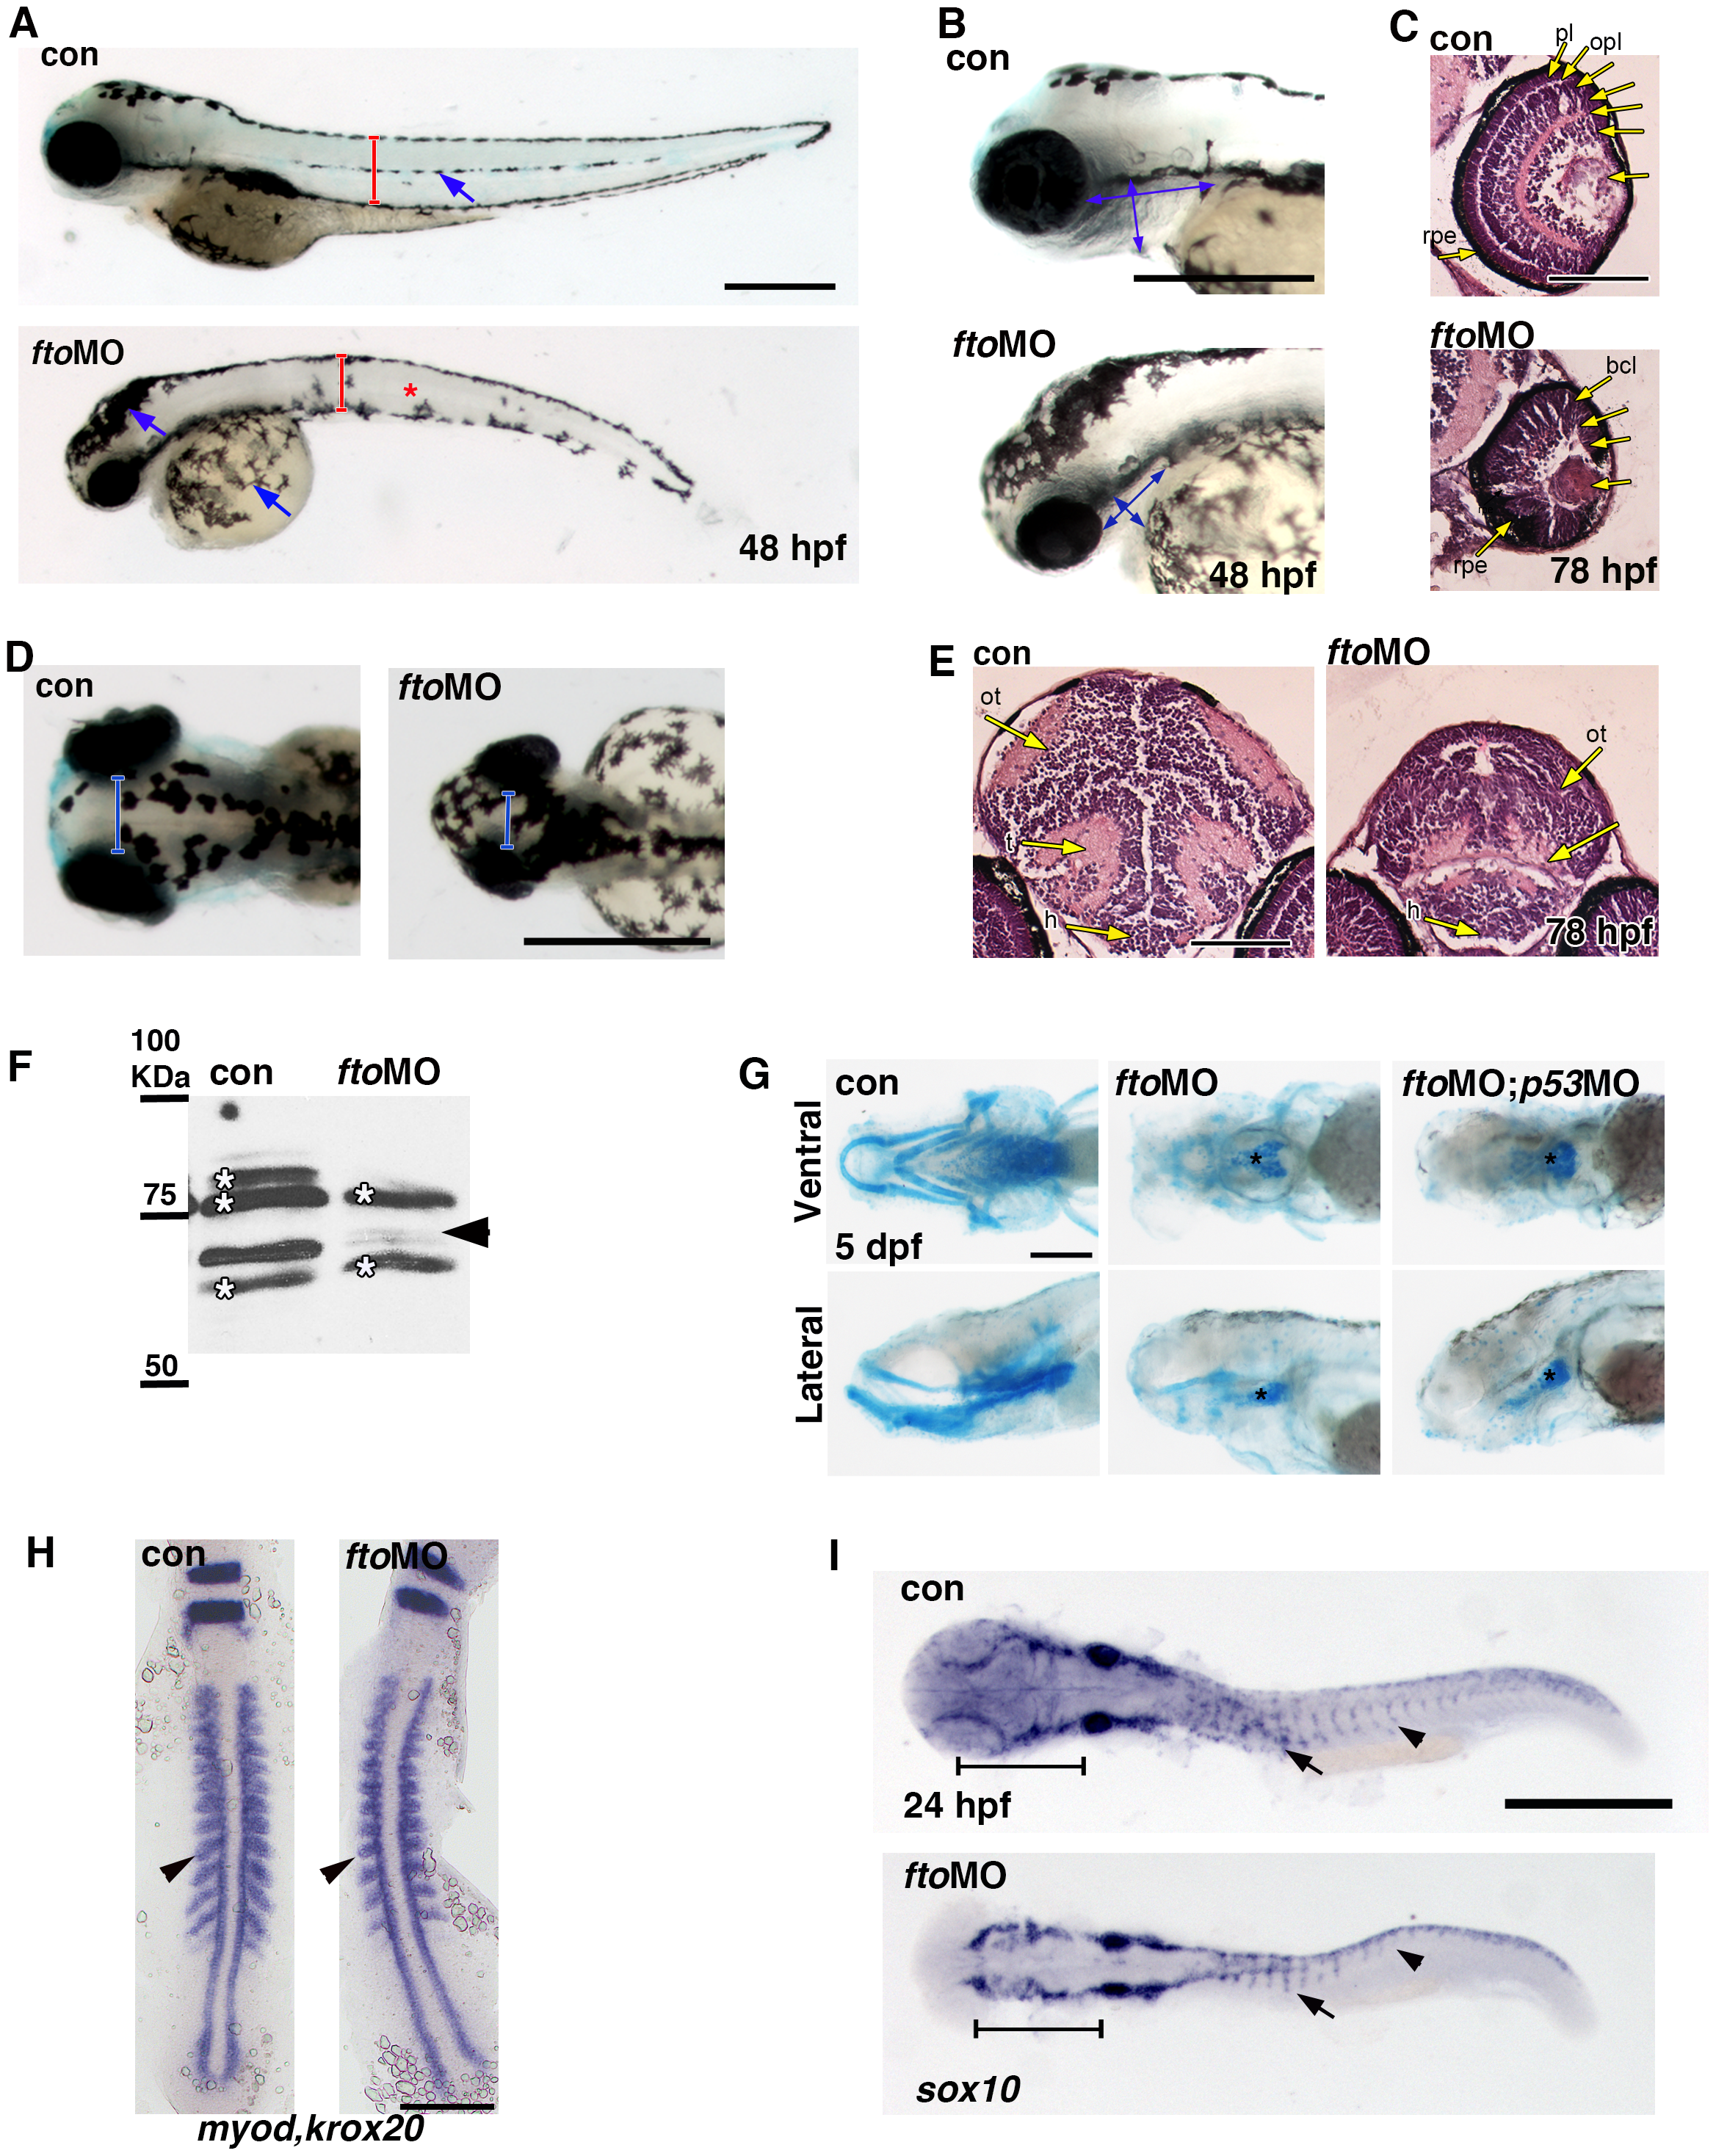
Loss of fto results in a craniofacial zebrafish phenotype.
(A,B) fto knockdown zebrafish display small eyes, shortened dorsal ventral axis (red brackets), reduced pharyngeal width and length (double headed blue arrows), mislocalised melanocytes (blue arrows and red asterisk) and a curved truncated body axis. Scale bar: 500 Ám, n = con 50/50, ftoMO 48/50. (C) Hematoxylin and Eosin staining on paraffin sections highlight loss of lamination and reduced size of the eye in fto morphants at 78hpf (n = con 10/10, ftoMO 10/10. Scale bar: 100 μm. pl; photoreceptor layer, opl; outer plexiform layer, bcl; bipolar cell layer, acl; amacrine cell layer, ipl; inner plaxiform layer, gcl; ganglion cell layer, rpe; retinal pigmented epithelium. (D) Dorsal whole mount view of control uninjected and fto morphant embryos at 48 hpf, morphants have reduced optic spacing (blue brackets) indicative of microcephaly. (E) Hematoxlyin and Eosin staining on transverse paraffin sections through the brain at eye level showing microcephaly in morphant embryos at 78 hpf. Scale bar: 100 μm. ot; optic tectum, t; tegmentum, h; hypothalamus. (F) Fto knockdown was confirmed in 48 hpf morphant embryos by western analysis using an anti-human FTO antibody, note the missing band at approximately 65KDa (arrow head). Asterisks indicate non-specific bands. (G) Embryos treated with the fto MO fail to develop the majority of head cartilage at 5 dpf compared to untreated controls, a reduced basal plate remains intact between treatments (asterisks). p53 MO was used to counteract off-target morpholino effects, p53 MO failed to rescue the ftoMO phenotype. Ventral and lateral views displayed in the top and bottom columns, respectively. Scale bar: 200 μm; n = con 30/30, ftoMO 36/41, ftoMO;p53MO 28/32. (H) In situ hybridisation for myod and krox20 in control and fto morphants at 14 hpf. Arrowheads indicate a reduction in somite size in morphants compared to controls. Scale bar 200 Ám; n = con 52/55, ftoMO 45/48. (I) Aberrant migration of NCCs, visualised using sox10 probe, was observed in the head (brackets) and trunk (arrows) of fto morphants. Scale bar: 500 μm; n = con 33/33, ftoMO 27/34.

