
|
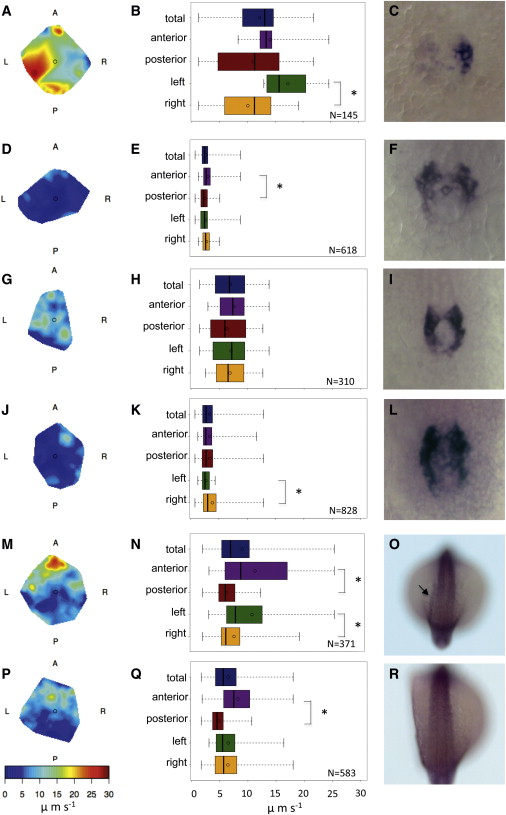
Fig. 6
Correlation between Fluid Flow and Early L-R Markers
(A?C) WT embryo with strong left-sided flow reported by flow heat map in (A) and by the quantification of flow in each KV half in (B) showing an asymmetric charon expression on the right side of the KV in (C).
(D?L) Embryos injected with dnah7-MO. (D) through (F) show embryo with very weak flow as reported by the flow heat map in (D) and the quantification of flow in each KV half in (E) showing a weak symmetric charon expression in (F). (G) through (I) show embryo with strong homogeneous flow as reported by the flow heat map in (G) and the quantification of flow in each KV half in (H) showing a strong symmetric charon expression (I). (J) through (L) show embryo with weak flow showing local elevated right-sided flow as reported by the flow heat map in (J) and the quantification of flow in each KV half in (K) showing a slight degradation of charon expression on the right side of the KV in (L).
(M?O) WT embryo with strong left-sided anterior flow reported by flow heat map in (M) and by the quantification of flow in each KV half in (N) showing an asymmetric spaw expression on the left side of the LPM in (O).
(P?R) WT embryo with no biased L-R flow as reported by flow heat map in (P) and by the quantification of flow in each KV half in (Q) showing absent spaw expression on the LPM in (R). N, number of particle tracks measured in each embryo. Boxplot whiskers represent the minimum and maximum of all of the data. Means are represented as small circles. p< 0.05, Wilcoxon test.
Reprinted from Developmental Cell, 29(6), Sampaio, P., Ferreira, R.R., Guerrero, A., Pintado, P., Tavares, B., Amaro, J., Smith, A.A., Montenegro-Johnson, T., Smith, D.J., Lopes, S.S., Left-Right Organizer Flow Dynamics: How Much Cilia Activity Reliably Yields Laterality?, 716-28, Copyright (2014) with permission from Elsevier. Full text @ Dev. Cell