Fig. 5
Dram1 Is Required to Contain Mm Growth inside Macrophages
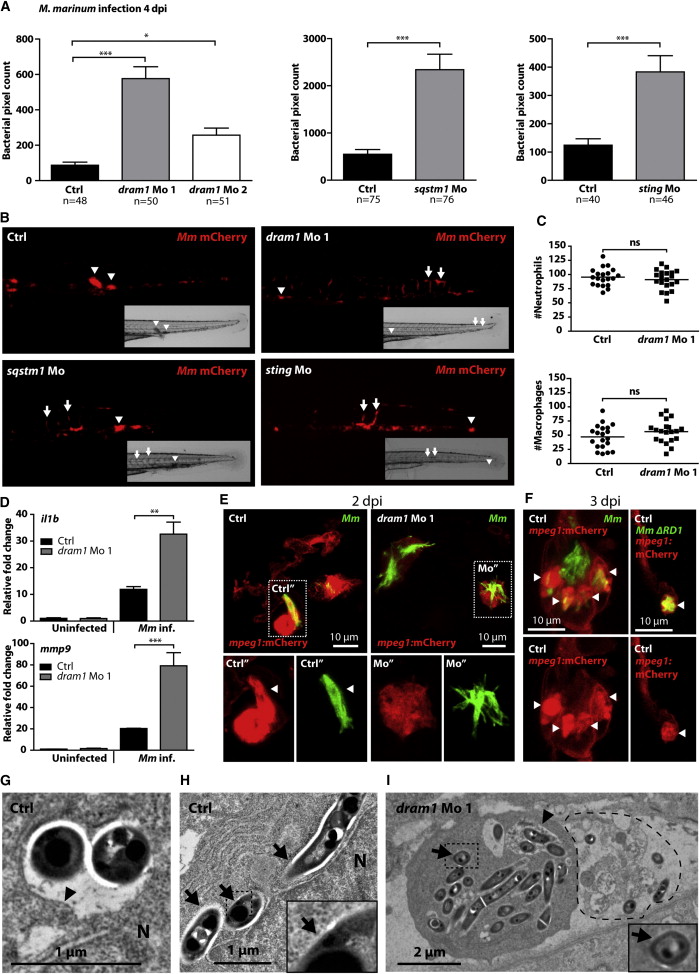
(A) Zebrafish embryos injected with standard control morpholino, morpholino against dram1 (dram1 Mo 1 and Mo 2), sqstm1 (sqstm1 Mo), or sting (sting Mo) were injected with mCherry-labeled Mm (see also Figure S5). Bacterial pixel counts were determined at 4 dpi. Data (mean ± SEM) is pooled from at least two individual experiments (n = 48?76 embryos per group).
(B) Stereo micrographs of the tail region of highly infected standard control, dram1 Mo 1-, sqstm1 Mo-, or sting Mo-injected embryos. Arrowheads indicate granuloma formation, and arrows indicate accumulation of bacteria in intersegmental veins.
(C) Total numbers of neutrophils and macrophages in 2 dpf control- or dram1 Mo 1-injected embryos were quantified using a fluorescence stereo microscope (n = 20 per condition, blinded). Total numbers of macrophages were determined by performing whole-mount L-plastin immunohistochemistry and deducting the number of cells positive for neutrophil-specific myeloperoxidase activity from the number of L-plastin-positive total leukocytes per embryo. Each data point represents an individual embryo, and lines indicate the mean.
(D) Expression levels of il1b and mmp9 at 4 dpi in control morpholino-injected and dram1 Mo 1-injected embryos with or without Mm infection (200 colony-forming units [cfu] for control and 50 cfu for dram1 Mo 1 to obtain equal bacterial burdens) were determined by qPCR (mean ± SEM from n = 3 biological replicates with 20 embryos per pool).
(E and F) Representative confocal micrographs of mpeg1:mCherry transgenic embryos injected with control or dram1 morpholino 1 and infected with GFP-labeled Mm or ΔRD1 Mm (E) 2 dpi or (F) 3 dpi. Boxed areas are detailed below, with the green and red channels shown separately. Arrowheads indicate bacteria enclosed by membranes.
(G?I) Transmission electron micrograph of control morpholino-injected embryos with bacteria inside a phagosome (G) or bacteria in the cytoplasm (H) or dram1 morpholino-injected embryos with bacteria present both in phagosomes and in the cytoplasm (I). Arrows indicate cytoplasmic bacteria, while arrowheads indicate phagosomal membranes. Boxed areas are enlarged in the insets, and the dashed line in (I) indicates the remnants of a dead infected cell. See also Figure S5.

