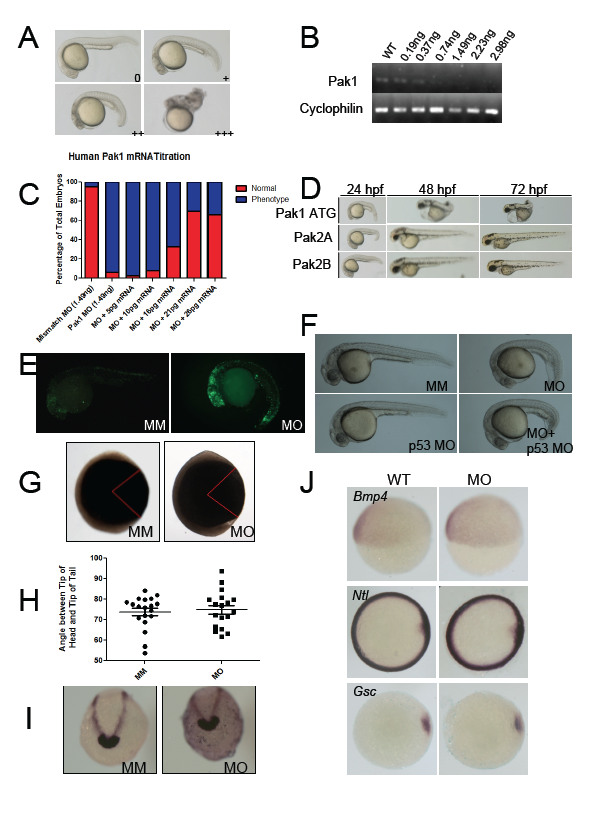
Fig. S1 Characterization of pak1 morphant phenotype. (A) Representative images of embryos displaying mild, moderate, and severe phenotypes when injected with a titration of the pak1 morpholino. Table describing phenotypes and n numbers are located in Supplemental Table S1. (B) RT-PCR of embryos injected with a titration of pak1 morpholino. (C) Percentages of embryos displaying aberrant phenotypes when injected with the Pak1 morpholino in addition to varying amounts of human pak1 mRNA. (D) Representative images of embryos from 24-72 hpf injected with pak1 ATG MO, pak2a MO, or pak2b MO. Table describing phenotypes and n numbers are located in Supplemental Table S2. (E) Apoptotic cells were detected by a TUNEL assay on 24 hpf mismatch MO injected embryos or pak1 morphants. (F) Embryos co-injected with p53- MO and pak1 MO displayed a similar phenotype to pak1 morphants. (G) Representative images of 2 somite stage embryos injected with either a mismatch or pak1 MO, displaying angle between tip of head and tip of tail. (H) Quantification of gastrulation angles from panel A. No significant difference between control and pak1 morphants. (I) Embryos fixed at 10 hpf. In situ staining was performed with probes hgg1 and dlx3. (J) Staining at 6 hpf is shown for the ventral fate marker bmp4, mesodermal marker ntl, and the dorsalising factor gsc. Related to Figure 1.
Reprinted from Developmental Cell, 29, Kelly, M.L., Astsaturov, A., Rhodes, J., Chernoff, J., A Pak1/Erk Signaling Module Acts through Gata6 to Regulate Cardiovascular Development in Zebrafish, 350-9, Copyright (2014) with permission from Elsevier. Full text @ Dev. Cell

