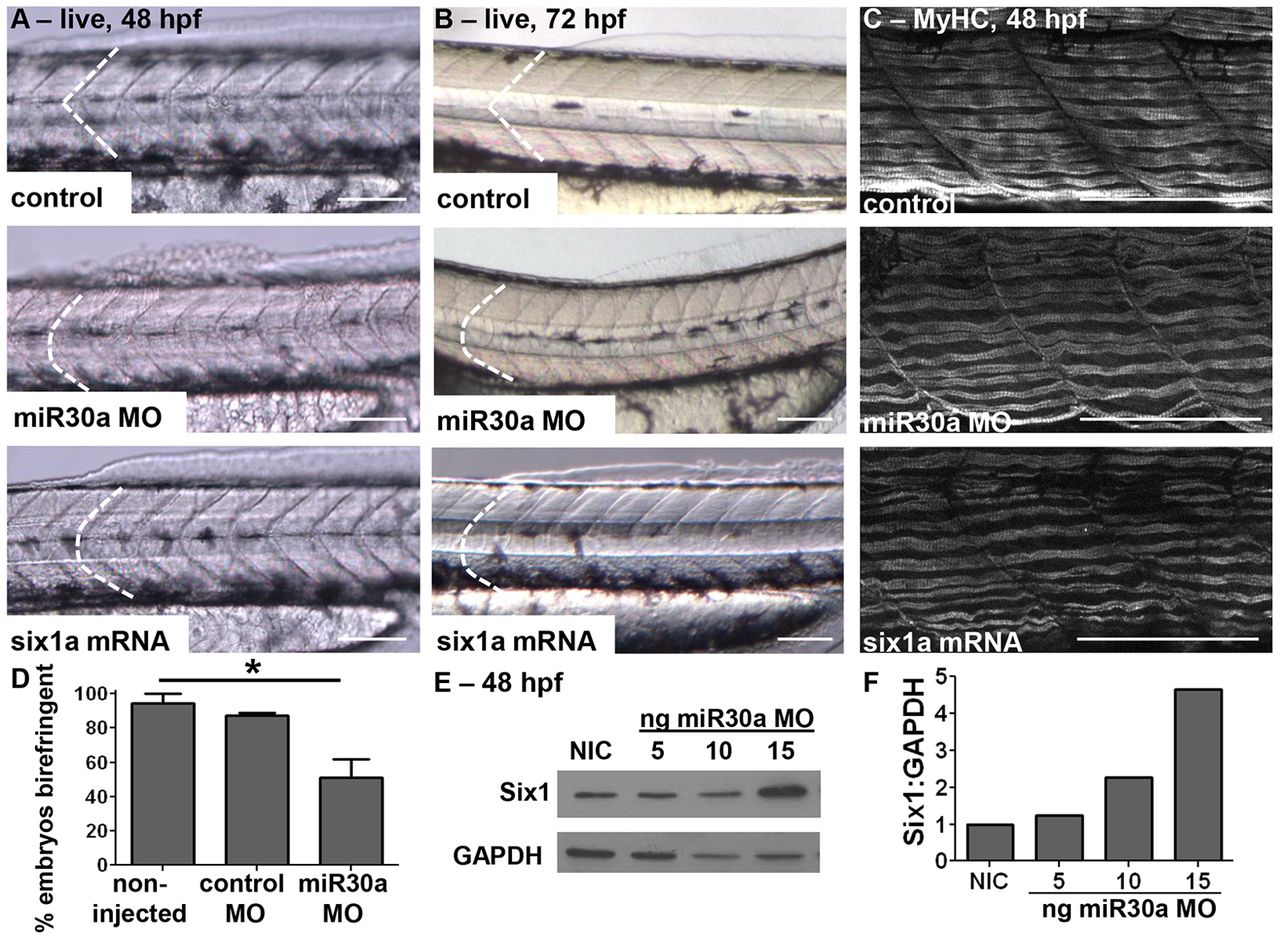
Fig. 5 miR30a knockdown leads to abnormal somite and myosin fiber morphology, and to increased Six1 expression. Live images, anterior to the left, at (A) 48 hpf (control, n = 54/58; miR30a MO, n = 49/64; six1a mRNA, n = 36/45) and (B) 72 hpf (control, n = 75/75; miR30a MO, n = 30/40; six1a mRNA, n = 28/33) showing that miR30a knockdown (middle row) disrupts normal somite morphology to phenocopy six1a mRNA overexpression (bottom row). (C) Confocal images of MyHC stained with the A4.1025 antibody (control, n = 23/25; miR30a MO, n = 19/28; six1a mRNA, n = 11/20), and (D) loss of birefringence [meanħs.e.m.; non-injected control (NIC) n = 37 total embryos; control MO, n = 23; miR30a, n = 56; *P = 0.027, ANOVA with Bonferroni′s post-hoc test] demonstrate abnormal muscle fiber morphology upon miR30a loss at 48 hpf. (E,F) Increasing concentrations of miR30a-targeted MO result in a dose-dependent increase in (E) Six1 protein expression as visualized by western blot analysis at 48 hpf and (F) quantified following normalization to GAPDH. Scale bars: 100µm. For A, B, n = the number of embryos represented by each image/the total number of embryos analyzed.
Image
Figure Caption
Figure Data
Acknowledgments
This image is the copyrighted work of the attributed author or publisher, and
ZFIN has permission only to display this image to its users.
Additional permissions should be obtained from the applicable author or publisher of the image.
Full text @ J. Cell Sci.

