Image
Figure Caption
Fig. S1
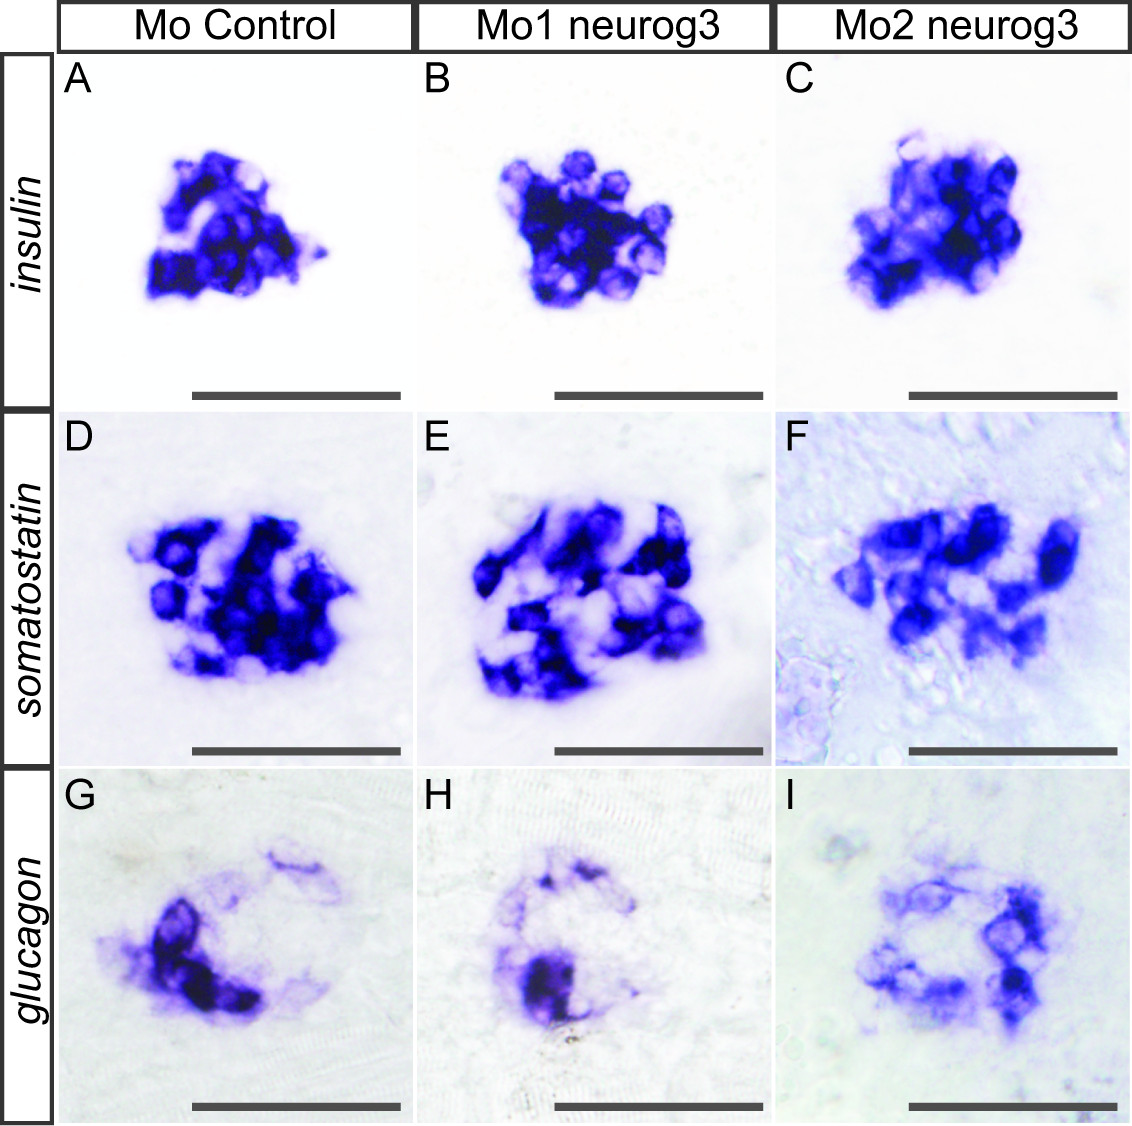
neurog3 morphants do not display any apparent endocrine defects. WISH showing that the number of cells expressing insulin (A-C), somatostatin (D-F) and glucagon (G-I) is not changed in the Mo1-neurog3 (B,E,H) or Mo2-neurog3 (C,F,I) morphants compared to the Mo-control (A,D,G) morphants at 30 hpf. All views are ventral with the anterior part to the left.
Acknowledgments
This image is the copyrighted work of the attributed author or publisher, and
ZFIN has permission only to display this image to its users.
Additional permissions should be obtained from the applicable author or publisher of the image.
Full text @ BMC Biol.

