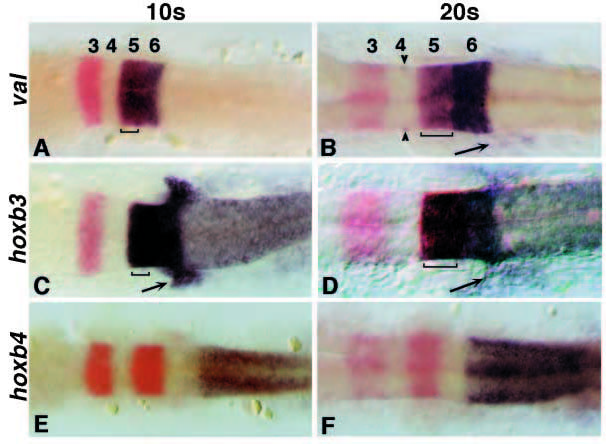
Fig. 3 Comparison of expression of val (A,B)with hoxb3 (C,D)and hoxb4 (E,F) at the 10s stage (A,C,E) and 20s stage (B,D,F); double in situs with krox-20 (red) to indicate r3 and r5; the precise extent of r5 is indicated with a bracket in A-D. (A) At the 10s stage val is expressed in presumptive r5+r6 (rhombomeres are numbered). (C) There is high level expression of hoxb3 in the corresponding r5+r6 region, note expression in emergent neural crest at the r6 level (arrow). (E) hoxb4 has not reached its anterior expression limit at this stage. (B) At the 20s stage val expression continues to be localized to r5 and r6, there is also expression in the Mauthner neurons in r4 (arrowheads) and low level expression in a small number of emergent neural crest cells (arrow). (D) The high level expression domain of hoxb3 continues to co-localize with the val expression domain in r5 and r6, note expressing neural crest cells (arrow). (F) hoxb4 has now reached its anterior limit at the r6/7 boundary, corresponding to the posterior limit of val expression.
Image
Figure Caption
Figure Data
Acknowledgments
This image is the copyrighted work of the attributed author or publisher, and
ZFIN has permission only to display this image to its users.
Additional permissions should be obtained from the applicable author or publisher of the image.
Full text @ Development

