Fig. 4
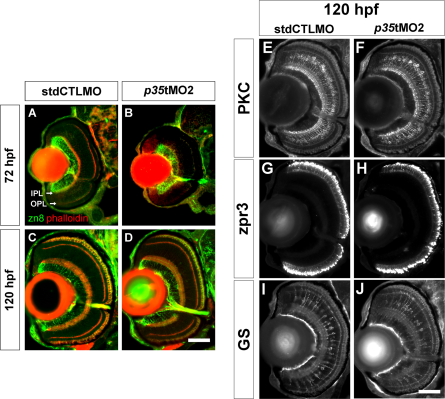
The differentiation of GCs, BCs, rods, and MCs appeared normal in the p35-morphant retinas. A?D: Immunohistochemical analysis of GCs in the controls (stdCTLMO) and p35 morphants (p35tMO2) was performed with anti-zn8 (zn8) at 72 and 120 hpf. The zn8 signal is shown in green, while the plexiform layers are highlighted by phalloidin in red. At 72 hpf, the number of GCs, as counted by the DAPI nuclei with positive zn8, was not different between the control and p35-morphant retinas (A, B). This result suggests that the formation of GCs was not affected by p35 knockdown. Even though the dendritic projections of GC appeared compromised in the p35-morphant retinas at this stage, the overall zn8 staining pattern between the control and p35-morphant retinas was comparable at 120 hpf (C, D). These observations suggest that the GC differentiation was normal by this stage. E?J: Immunohistochemical analysis of BCs, rods, and MCs in the controls and p35 morphants was performed with anti-PKC βI (PKC), anti-zpr3 (zpr3), anti-GS (GS) at 72 hpf (data not shown) and 120 hpf. The p35 knockdown substantially reduced the staining signal of these markers in the p35-morphant retinas compared with the controls at 72 hpf. However, the staining became very comparable between the two conditions at 120 hpf. In these images, lateral is to left and dorsal is up. IPL: inner plexiform layer; OPL: outer plexiform layer. Scale bars = 50 μm.

