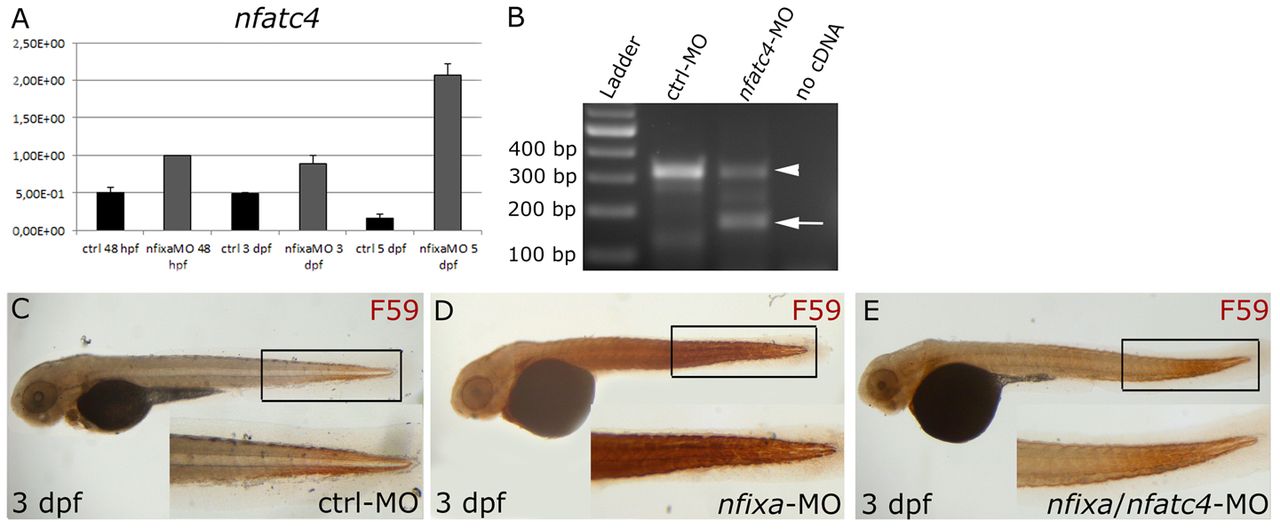
Fig. 5 Evolutionarily conserved inhibition of nfatc4 by nfixa and regulation of primary slow fibers. (A) Quantitative real-time PCR (qRT-PCR) of nfatc4 mRNA expression normalized to ef1a. The expression of nfatc4 remains elevated in 48 hpf, 3 and 5 dpf nfixa-MO injected embryos, compared with controls. (B) RT-PCR on control and splice-nfatc4-MO-injected embryos at 24 hpf. RT-PCR primers were designed in exon 1 and exon 3, respectively; the amplification product, which contains the second exon, was 326 bp in control embryos, whereas two bands at 326 bp (arrowhead) and 174 bp (arrow) were detected in splice-nfatc4-MO injected embryos, confirming the partial skipping of the second exon (150 bp). (C-E) Immunostaining with F59 antibody (slow fibers): at 3 dpf, nfixa-nfatc4-MO injected embryos (E) present a F59 signal comparable with controls (C), whereas F59 remains elevated in nfixa-MO-injected embryos (D).
Image
Figure Caption
Figure Data
Acknowledgments
This image is the copyrighted work of the attributed author or publisher, and
ZFIN has permission only to display this image to its users.
Additional permissions should be obtained from the applicable author or publisher of the image.
Full text @ Development

