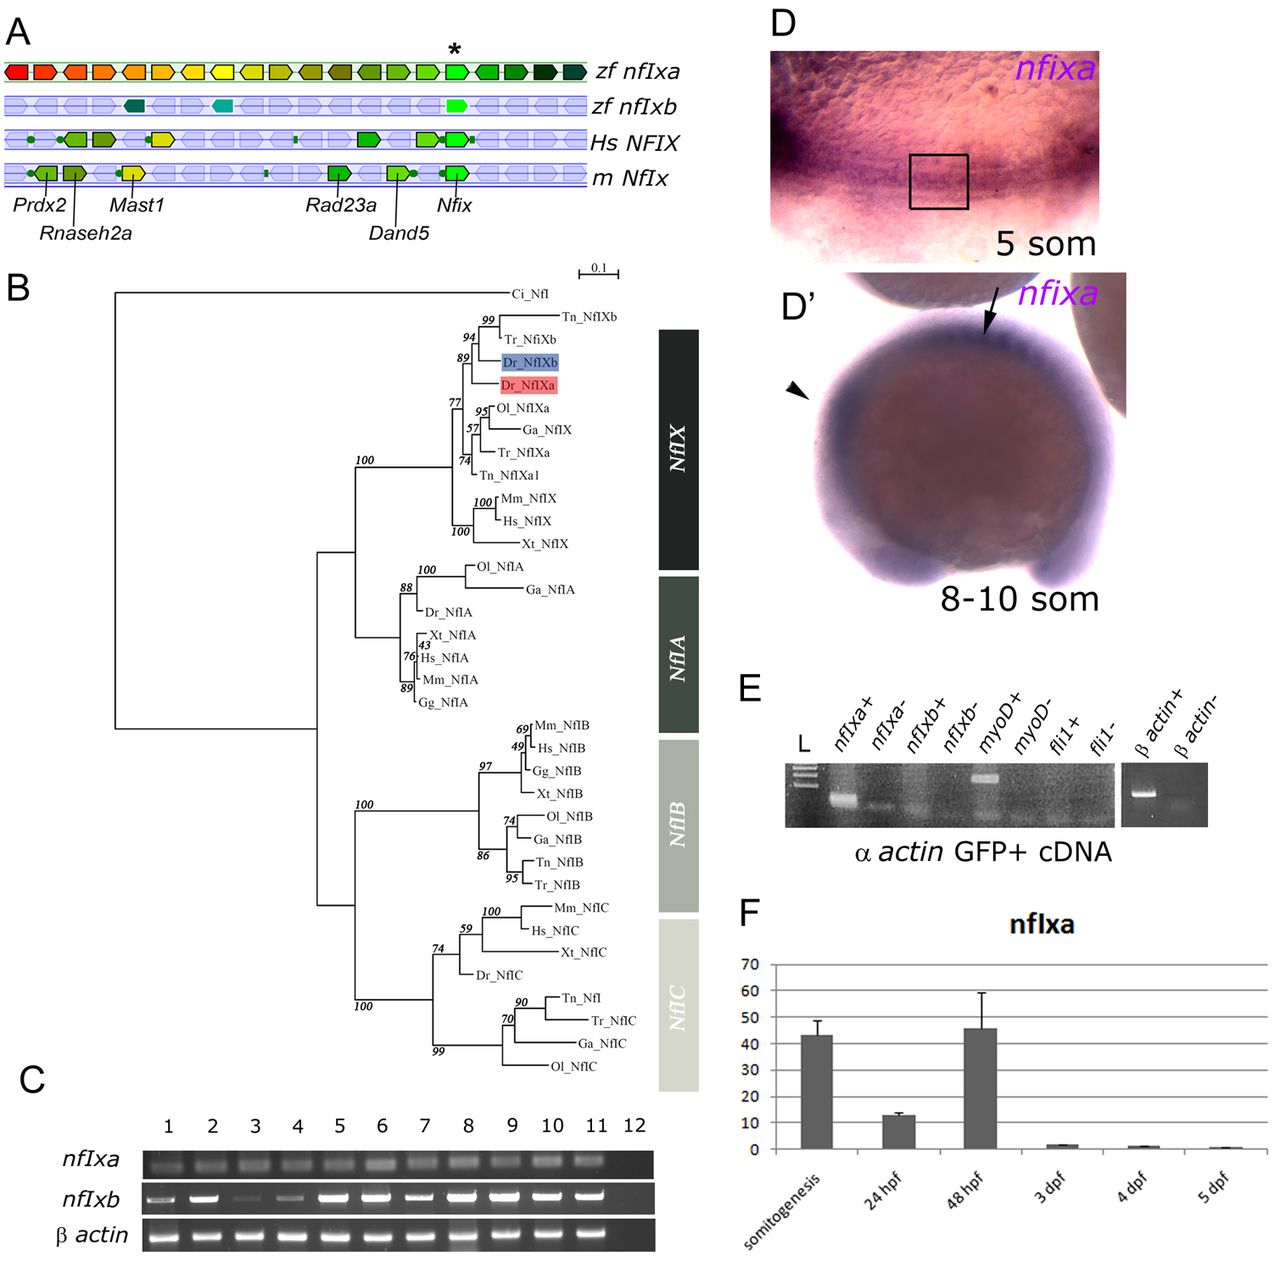
Fig. 1 Identification and expression analysis of nfixa and nfixb. (A) Each zebrafish nfix gene is shown as a reference locus. Genes annotated as paralogs (no surrounding line) or orthologs (with a surrounding line) by the Ensembl database share the same color; blue lines beneath individual tracks indicate that orientations of gene blocks and are inverted with respect to their genomic annotation. Analysis of chromosomal organization for zebrafish nfixa (chromosome 1), nfixb (chromosome 3), and the human (chromosome 19) and mouse (chromosome 8) Nfix genes. Syntenous human and mouse genes are labeled. The figure was derived from the output of the Genomicus website (version 57.01). (B) Phylogenetic relationship of Nfi genes. Evolutionary comparison of different members of Nfi protein family represented in a Maximum-likelihood bootstrap consensus tree. The zebrafish nfixa and nfixb are highlighted. Branch lengths are measured in terms of amino acid substitutions, with the scale indicated over the tree. Numbers at nodes indicate percent of bootstrap probabilities. Ce, Caenorhabditis elegans; Ci, Ciona intestinalis; Dr, Danio rerio; Ga, Gasterosteus aculeatus; Gg, Gallus gallus; Hs, Homo sapiens; Mm, Mus musculus; Ol, Oryzias latipes; Tn, Tetraodon nigroviridis; Tr, Takifugu rubripes; Xt, Xenopus tropicalis. (C) RT-PCR performed at different developmental stages: ladder (L), one- to two-cell stage (lane 1), 30% epiboly (lane 2), 50% epiboly (lane 3), tail bud (lane 4), eight somites (lane 5), 15 somites (lane 6), 24 hpf (lane 7), 48 hpf (lane 8), 3 dpf (lane 9), 5 dpf (lane 10), adult muscle (lane 11) and negative control (lane 12) in the absence of cDNA. (D,D2) Whole-mount in situ hybridization with nfixa-specific probe at the 5-somite stage and 8-10 somite stage. (D) The transcript is present in the unsegmented paraxial mesoderm and in the notochord (boxed region). (D′) nfixa signal is present in the already segmented somites (arrow) and in the central nervous system (arrowhead). (E) RT-PCR performed on cDNA of muscle cells sorted from α-actin GFP transgenic embryos at 24 and 48 hpf. White line marks lanes run on a separate gel but using the same samples and amounts of input RNA. (F) Quantitative real-time PCR (qRT-PCR) of nfixa mRNA expression normalized to ef1a.
Image
Figure Caption
Figure Data
Acknowledgments
This image is the copyrighted work of the attributed author or publisher, and
ZFIN has permission only to display this image to its users.
Additional permissions should be obtained from the applicable author or publisher of the image.
Full text @ Development

