
Image
|
Figure Caption
Fig. 4
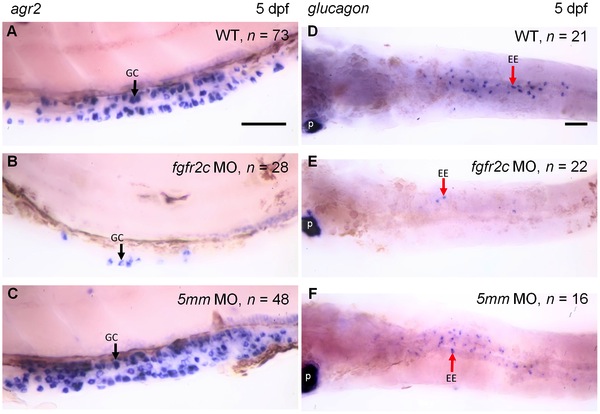
The expression of agr2 and glucagon in fgfr2c morphants.
WISH of agr2 (A–C, lateral view) and glucagon (D–F, ventral view) were used to analyze goblet cell and enteroendocrine differentiation, respectively, in 5 dpf embryos. Black arrows indicated the goblet cells (gc) and red arrows indicated the enteroendocrine cells (ee). p: Pancreatic alpha cells. Scale bars = 50 μm.
Figure Data
Acknowledgments
This image is the copyrighted work of the attributed author or publisher, and
ZFIN has permission only to display this image to its users.
Additional permissions should be obtained from the applicable author or publisher of the image.
Full text @ PLoS One