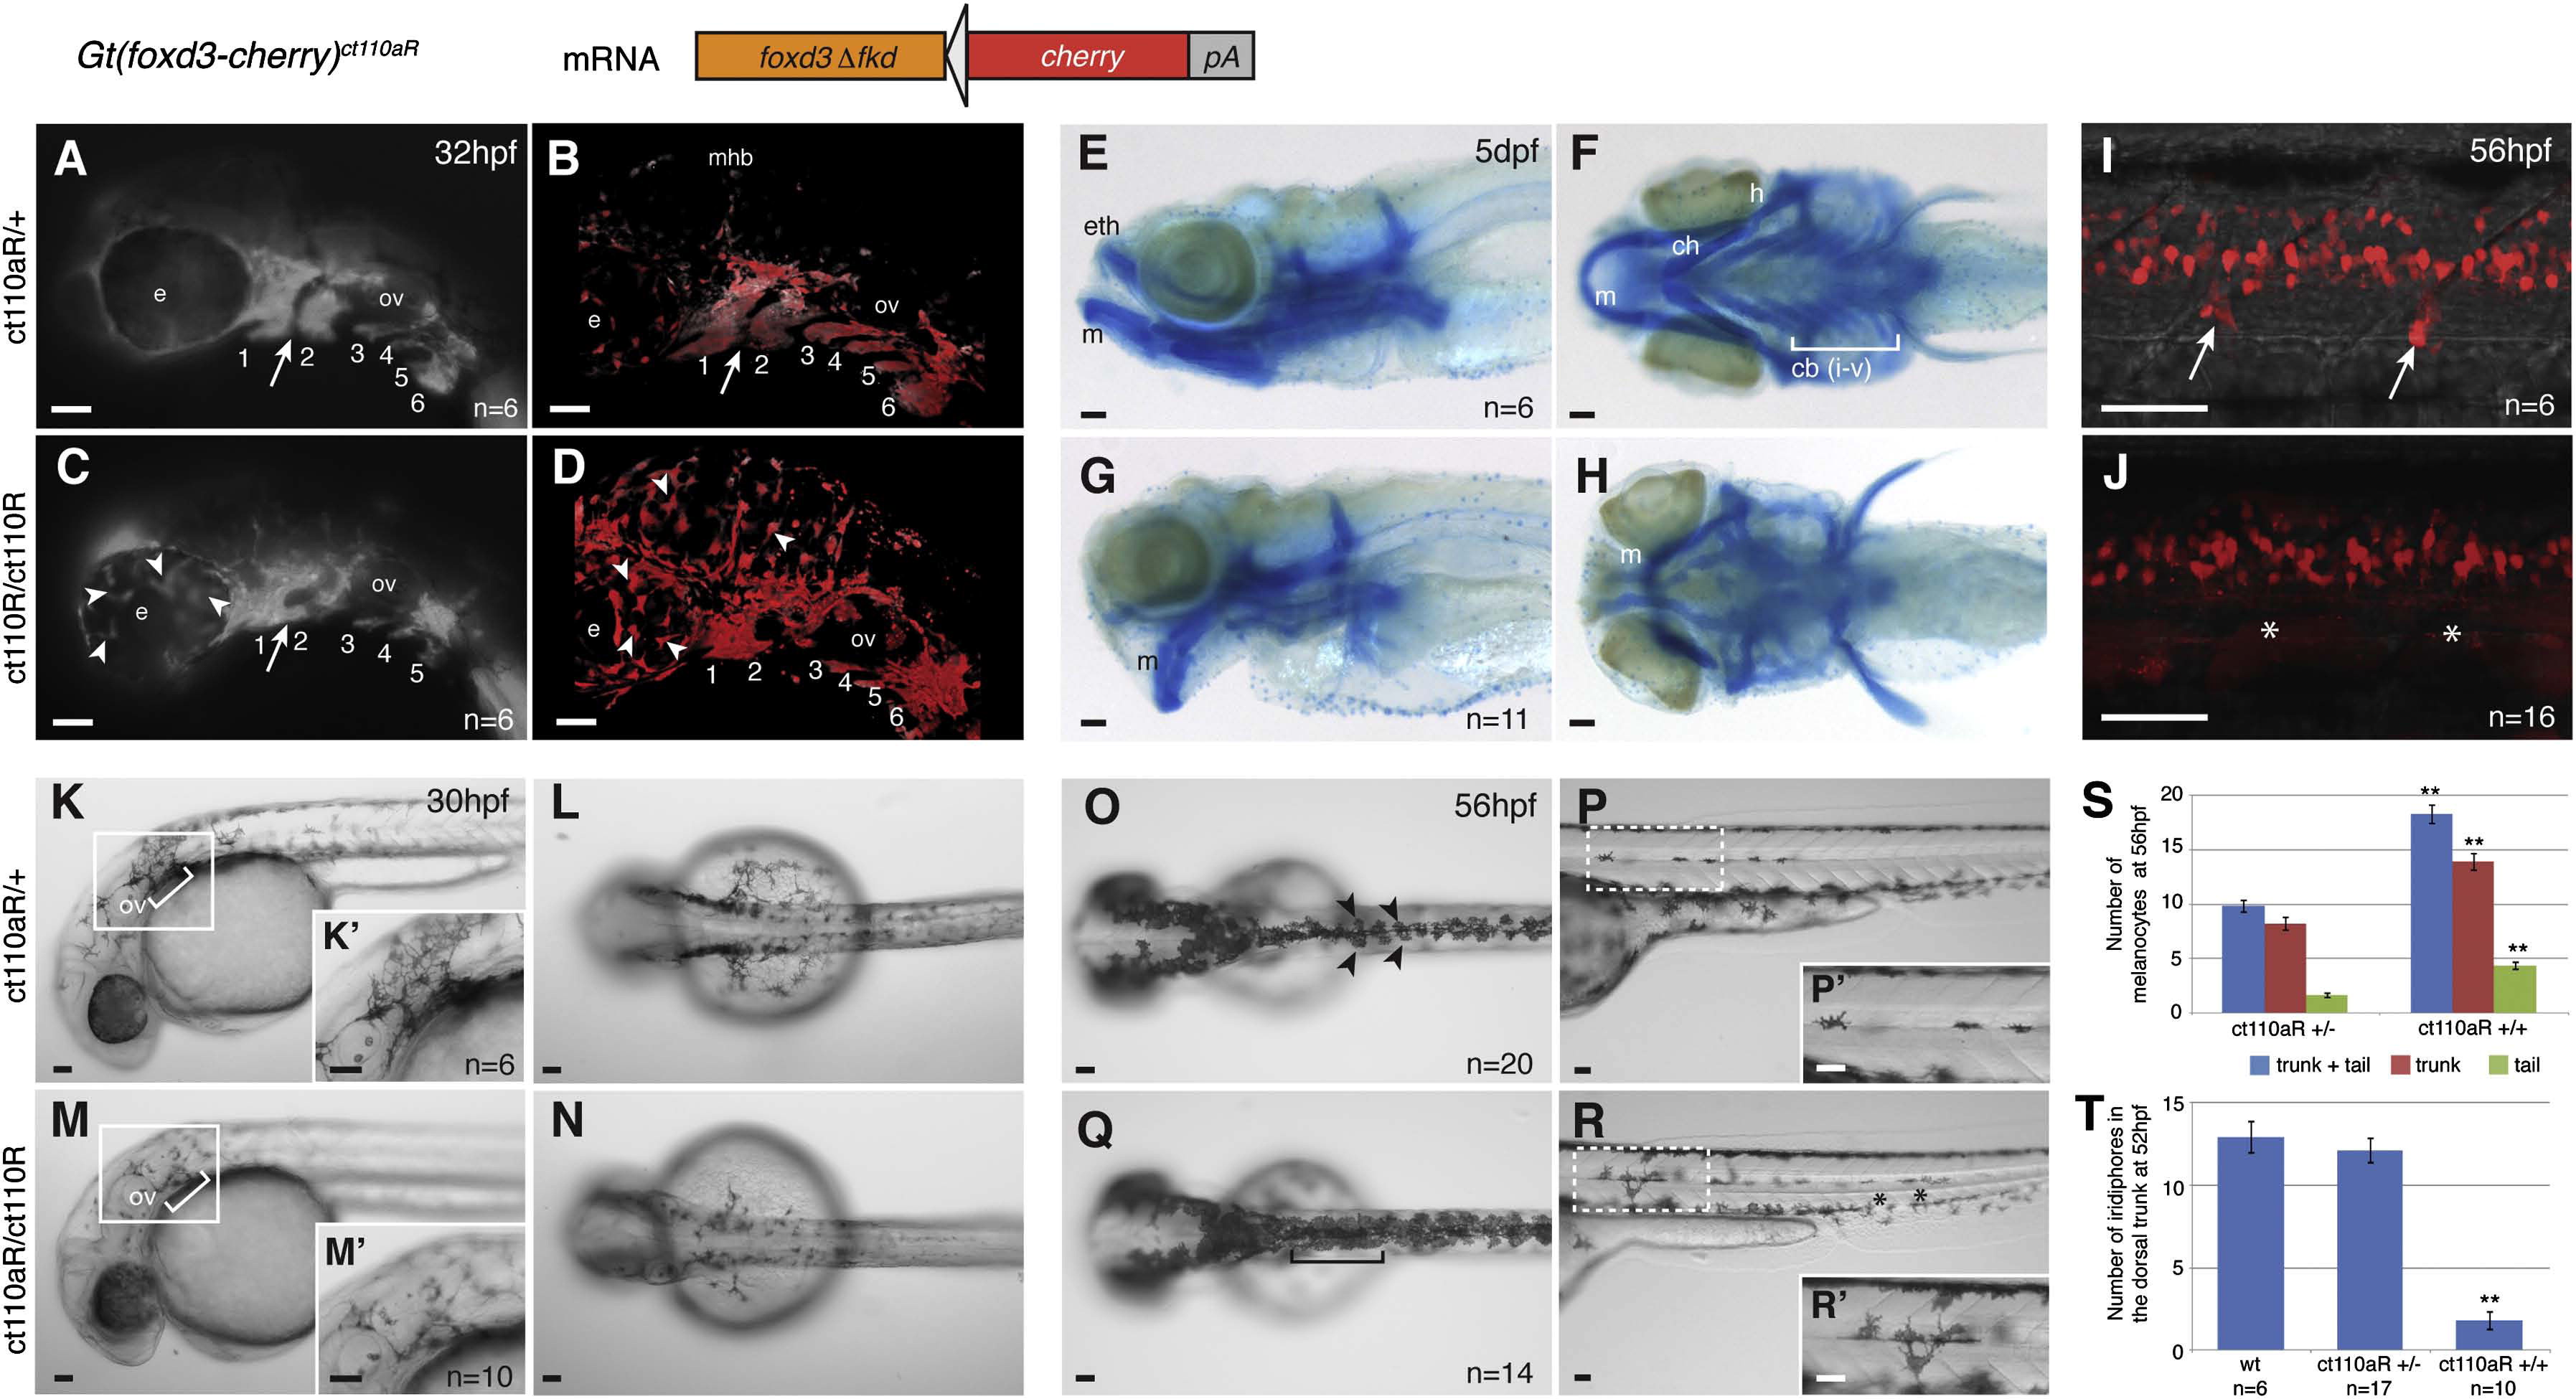
Fig. 5 FoxD3 loss-of-function in Gt(foxd3-mcherry)ct110aR homozygotes reveals multiple aspects of FoxD3 mutant phenotype. Development of Gt(foxd3-mcherry)ct110aR heterozygotes (ct110aR/+) is normal. Homozygosis (ct110aR/ct110aR) results in a FoxD3 mutant phenotype. (A?D) Loss of FoxD3 affects migration of NCCs to the pharyngeal arches. Six embryos with each genotype were live imaged and analyzed, showing similar phenotypes. Lateral views, anterior to the left. (A and C) Images of mCherry fluorescence in the head of Gt(foxd3-mcherry)ct110aR embryo. (B and D) Confocal projections of Gt(foxd3m-mcherry)ct110aR embryos head region. Expression of FoxD3-mCherry allows visualization of NCCs in the branchial arches of Gt(foxd3-mcherry)ct110aR embryos. (A) Normal development and segmentation of pharyngeal arches (1?6) in Gt(foxd3-mcherry)ct110aR heterozygotes. (B) Confocal imaging of Gt(foxd3-mcherry)ct110aR heterozygous embryo shows FoxD3-positive cells sparsely distributed in a ring-like arrangement around and on top of the eyes (e), and outlining the midbrain-hindbrain boundary (mhb). (C) In Gt(foxd3-mcherry)ct110aR homozygotes, segmentation between the first (1) and second (2) pharyngeal arches is disrupted (white arrow). Posterior arches (3?6) are present, but show reduced sizes in homozygotes. (D) Confocal imaging shows an overall increase in mCherry-positive cells in Gt(foxd3-mcherry)ct110aR homozygotes. Note mesenchymal-like aspect of mCherry-positive cells, with less adhesion and more cytoplasmic protrusions. In particular, large cells are widely distributed throughout the eyes and brain (arrowhead). (E?H) Morphogenesis of the jaw cartilage is disrupted in foxd3 mutants. Alcian Blue staining of Gt(foxd3-mcherry)ct110aR embryos at 5 dpf. (E,G) Lateral view, anterior to the left. (F,H) Ventral views. (E and F) Craniofacial cartilage develops normally in Gt(foxd3-mcherry)ct110aR homozygotes. (G) Cartilage defects in Gt(foxd3m-mcherry)ct110aR homozygotes are characterized by ventral projection of the Meckel′s cartilage (m) and ethmoid plate (eth). Derivatives of the second arch (ceratohyal, ch and hyosymplectic, h), as well as ceratobranchials I?V (cb i?v), are hypoplastic and malformed. (I and J) Formation of DRGs is disrupted in Gt(foxd3-mcherry)ct110a homozygous embryos. (I and K) Confocal projection of mCherry-positive cells in the trunk of live Gt(foxd3-mcherry)ct110a embryos at 56 hpf. DRGs emerge from the neural tube at the level of the anterior half of each somite. (I) FoxD3 is expressed in the glial cells associated with the DRGs (white arrows). (J) Gt(foxd3-mcherry)ct110a homozygotes consistently lack DRGs and associated glia (white asterisks), disrupting the periodicity of DRG emergence from the neural tube. (K?N) Specification of melanophores is delayed in FoxD3 mutants. Live embryos at 30 hpf, anterior to the left. (K and M) Lateral views. (L and N) Dorsal views. (K and L) Melanophores concentrate posterior to the otic vesicle (ov), from where they migrate over the yolk. (M and N) Melanophores are consistenly reduced in Gt(foxd3-mcherry)ct110a homozygotes at 30 hpf. (K′,M′) Higher magnification of the boxed area. (O?S) FoxD3 is a repressor of the melanocytic lineage at the expense of iridophore cells. (O and Q) Dorsal view of live embryos, anterior to the left. (P and R) Left lateral view, trunk region. (O) Melanophores are distributed in a characteristic pattern in the zebrafish embryo at 56hpf. They can be individually visualized along the dorsal part of the trunk and tail (black arrowheads). (P and P′) Melanophores are also distributed as flat cells along the lateral line, mostly at the level of the trunk. (Q) In Gt(foxd3-mcherry)ct110a homozygotes, dorsal melanophores are increased in the trunk, but not in the head region. (R) Melanophores in the lateral line are increased in homozygotes (n=14), with greater incidence of cells in the tail region (black asterisks). Melanophores appear dislocated from the lateral line and present increased cytoplasmic protrusions (R′). (S) Quantification of melanophores in the trunk and tail region of embryos at 56 hpf. Significant increase was observed in homozygotes. **P<0.001. (T) Quantification of ridophores in the dorsal trunk of embryos at 52 hpf. Iridophores are significantly reduced in homozygous Gt(foxd3-mcherry)ct110a at 52 hpf. **P<0.0001. Scale bars: 50 μm.
Reprinted from Developmental Biology, 374(1), Hochgreb-Hägele, T., and Bronner, M.E., A novel FoxD3 gene trap line reveals neural crest precursor movement and a role for FoxD3 in their specification, 1-11, Copyright (2013) with permission from Elsevier. Full text @ Dev. Biol.

