
Fig. 6
|
Fig. 6
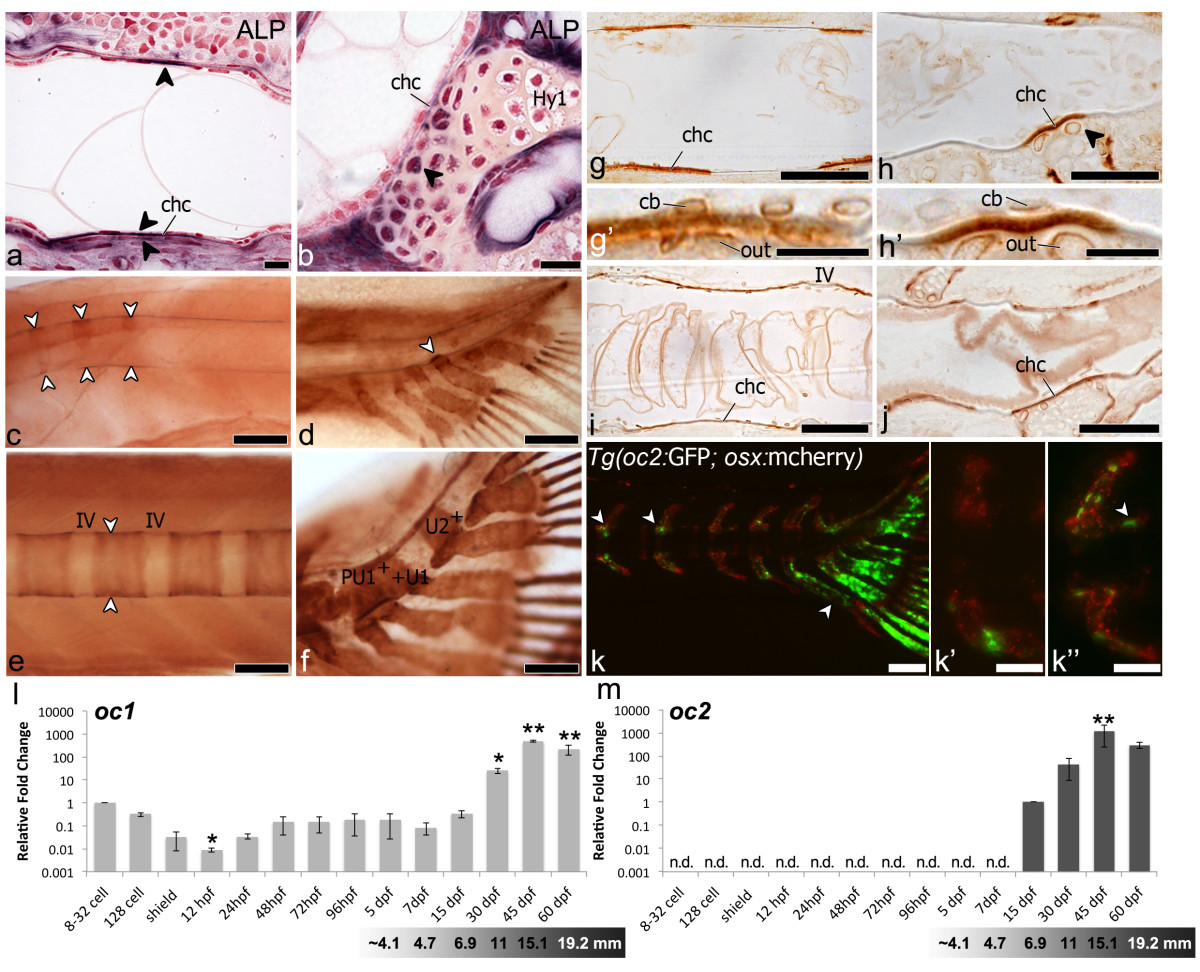
Mineralization and centrum formation, lateral views, anterior left. (a) ALP in a ?ring?-centrum (5.0mm TL) adjacent to chordacentrum (chc) mineralization site (arrowheads). (b) In caudal fin centrum (6.2mm TL) ALP (arrowhead) in arch-chondrocytes next to chordacentrum. Fast red counterstaining. Osteocalcin (arrowheads) in early mineralized (c) ?ring?-centra (4mm TL), and (d) caudal fin centra (5.9mm TL). Osteocalcin in later stages: (e) ?Ring?-centra (5.9mm TL), incremental marks (arrowheads), and (f) caudal fin centra, uniform staining. Sections of wholemount Osteocalcin immunostaining (g-j). In early chordacentra (5.9mm TL) Osteocalcin accumulates in the notochord sheath in: (g) ?ring?-centra and (h) caudal fin centra. Co-localization with arch attachment (arrowhead). (g′) Detail of (g). Chordoblasts (cb), outer cells (out). (h′) Detail of (h). Osteocalcin-positive chondrocytes (out). In advanced chordacentra (i, j) uniform Osteocalcin accumulation in the matrix, 6.1mm and 6.9mm TL. (k) Tg(oc2:gfp; osx:mcherry) transgenic fish, 12mm TL. oc2-positive cells (green), at neural and haemal arches next to ?ring?-centra (arrowheads). Osx-positive cells (red) cover vertebral centra. Gradient between (k′) less developed (oc2-negative) and (k′′) more developed (oc2-positive) centra. (k′′) Oc2 cells (white-arrowhead) next to an autocentrum. (l, m) qPCR, relative gene expression. oc1 and oc2. First detection of transcripts is the reference, represented by a 1-fold change (oc1:8-32 cells, oc2: 15dpf). Oc1, maternally transcribed, decreases at 12hpf (p<0.01), increases after 30dpf (p<0.01). Oc2, detected at 15dpf, increases at 45dpf (p<0.001). Age-size conversion under graphs. Hy1 ? Hypural 1; IV ? intervertebral space; n.d. ? not detected. Scale bars: (a-b, g′-h′) 10 μm; (c-f, k) 1mm; (g-j, k′-k′′) 0.5mm.