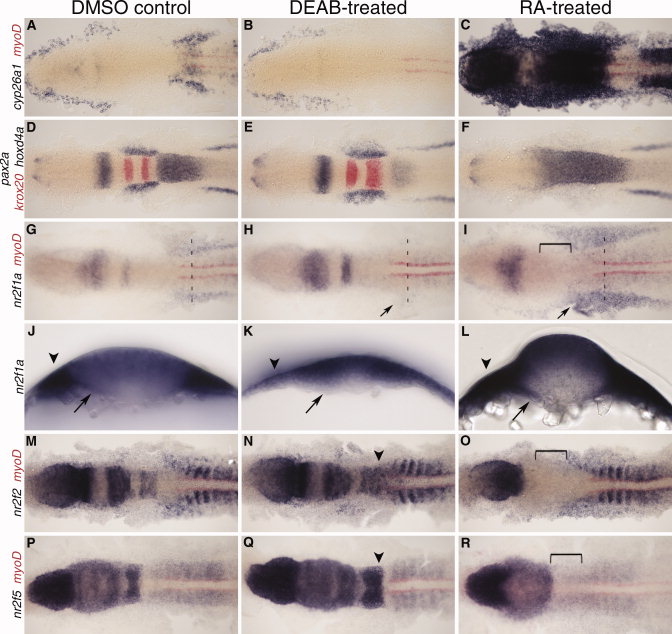
Fig. 5 nr2f expression at 12 hours post fertilization (hpf) with retinoic acid (RA) and DEAB treatment 8?10 hpf. A?C: Expression of RA target gene cyp26a1 to confirm treatment efficiency, co-stained with myoD (red) to mark the myotome. D?F: MHB and hindbrain markers pax2a, krox20 (red), and hoxd4a show changes in tissue specification. G?I: nr2f1a expression. Arrow indicates changes in lateral plate mesoderm (LPM) expression. J?L: Transverse sections showing changes in nr2f1a transcript levels in the endoderm (arrows) and LPM (arrowheads) at anteroposterior levels designated by dashed lines in G?I. M?O: nr2f2 expression. P?R: nr2f5 expression. N,Q: Arrowheads indicate a posterior extension of hindbrain expression. Brackets indicate loss of hindbrain expression.
Image
Figure Caption
Figure Data
Acknowledgments
This image is the copyrighted work of the attributed author or publisher, and
ZFIN has permission only to display this image to its users.
Additional permissions should be obtained from the applicable author or publisher of the image.
Full text @ Dev. Dyn.

