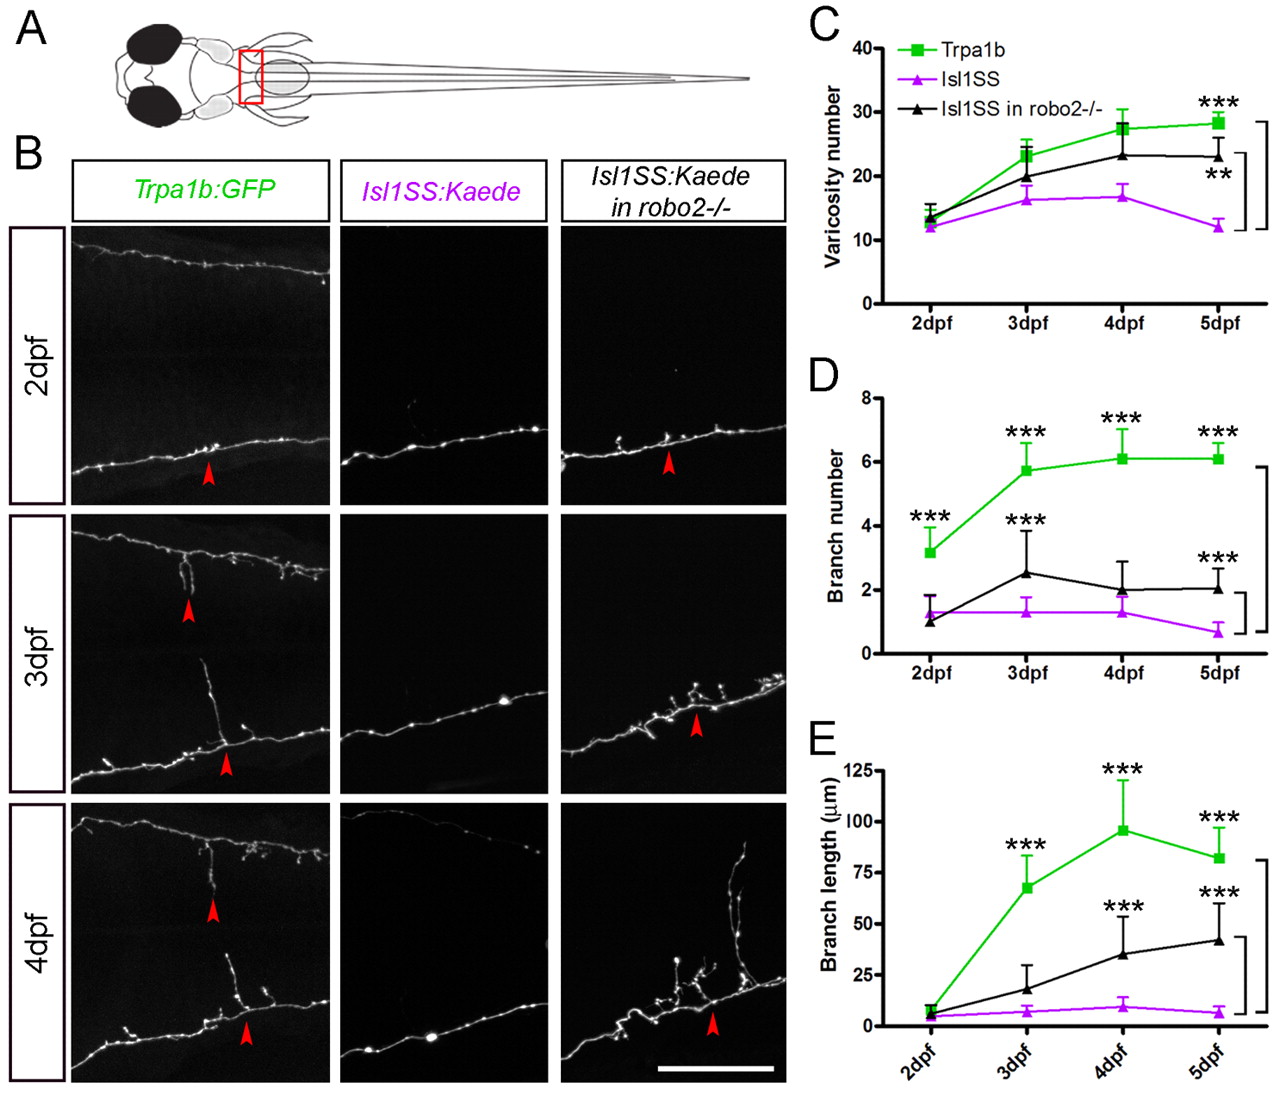
Fig. 7 Morphogenesis of subtype-specific branch growth and synaptogenesis. (A) Multi-time point imaging was performed in segments 9-11 (boxed area), where the innervation pattern differs most between Trpa1b and Isl1SS neurons. (B) Fluorescent images of individual trigeminal sensory neuron afferents imaged from 2 to 4 dpf. Representative examples are shown for Trpa1b (left column), Isl1SS (middle) and Isl1SS in robo2-/- (right) zebrafish. Red arrowheads point to branches. (C-E) Afferent morphology is compared between genotypes (wild type versus robo2-/- in the Isl1SS subtype) and subtypes (Trpa1b versus Isl1SS). Error bars indicate s.e.m. **, P<0.01; ***, P<0.001. Scale bar: 50 μm.
Image
Figure Caption
Figure Data
Acknowledgments
This image is the copyrighted work of the attributed author or publisher, and
ZFIN has permission only to display this image to its users.
Additional permissions should be obtained from the applicable author or publisher of the image.
Full text @ Development

