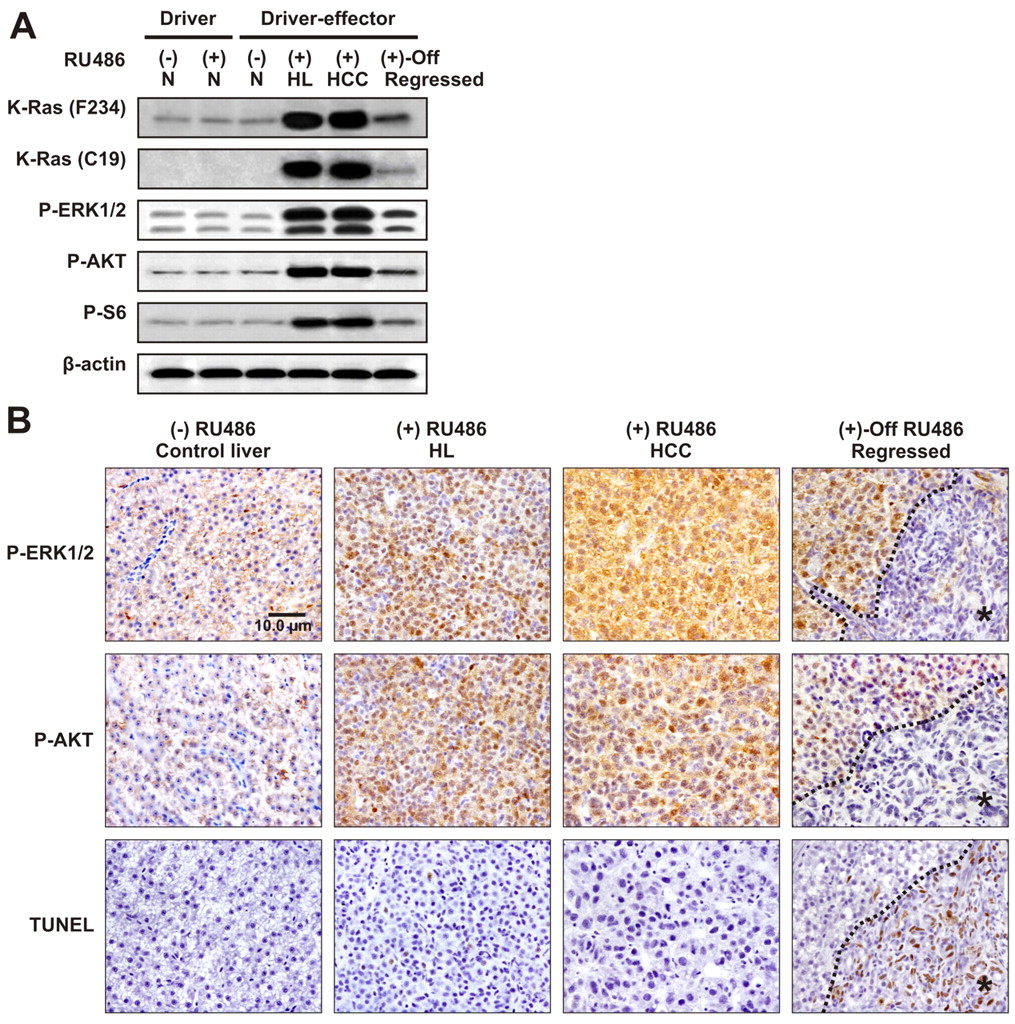
Fig. 3
Roles of the Raf-MEK-ERK and PI3K-AKT-mTOR pathways during krasV12 tumor progression and regression. (A) Western blots using total liver proteins from induced driver-effector fish with HL or HCC, as well as regressed liver samples, to detect total Kras (F234), mutant Kras-2B (C19) isoform, phospho-ERK1/2 (P-ERK1/2), P-AKT and P-S6 proteins. The non-induced driver, induced-driver and non-induced driver-effector having normal liver (N) served as controls.β-actin, internal control for equal loading. (B) Immunohistochemical staining showing phospho-ERK1/2 and -AKT protein as well as apoptotic cells (TUNEL) during krasV12-dependent liver tumor progression and regression. Asterisks and dotted lines indicate the region of tumor scar.

