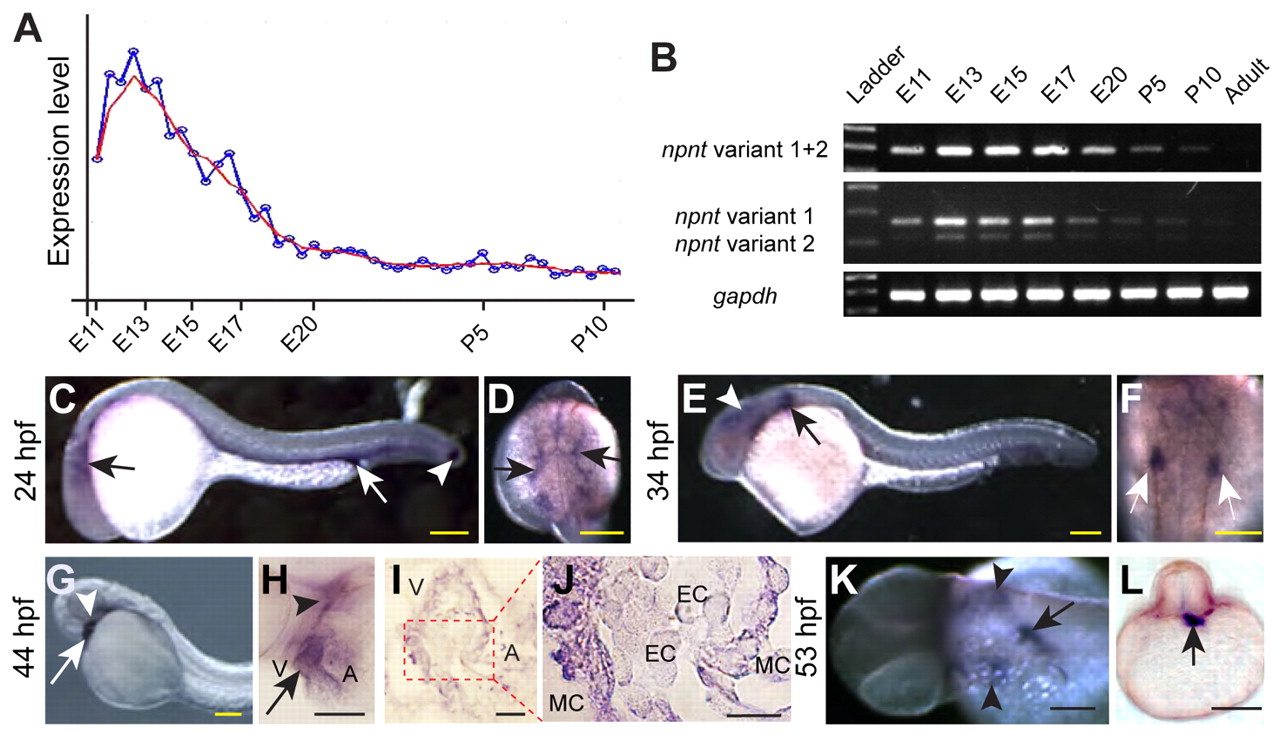
Fig. 1 npnt is transiently expressed during rat and zebrafish heart development. (A) Npnt expression levels in rat heart tissue from E11 to P10.5 in 12-hour intervals according to microarray analysis (Affymetrix GeneChip Rat Expression Set 230). Blue line, real profile; red line, smoothened profile. (B) RT-PCR analysis of Npnt mRNA expression during rat heart development. Gapdh was used as loading control. Ladder indicates a size marker. (C-L) Zebrafish npnt expression determined by whole-mount in situ hybridization. (C) Lateral view of a 24 hpf embryo showing npnt expression at tailbud (white arrowhead), head (black arrow) and posterior part of the gut (white arrow). (D) Dorsal view of the anterior part of the trunk demonstrating expression in pharyngeal endoderm (arrows). (E,F) Lateral (E) and dorsal (F) views at 34 hpf showing expression in the pronephric region (arrows) and head (arrowhead). (G,H) Ventrolateral view (G) and parasagittal section (H) at 44 hpf demonstrating npnt expression in heart (arrows) and jaw (arrowheads). (I,J) Paraffin section (4 μm) confirming expression in the myocardium (I, 200×; J, 1000×). (K) Dorsal view showing npnt expression at 53 hpf in pharynx, esophagus (arrow) and pharyngeal endoderm (arrowheads). (L) Transverse section through the trunk confirming expression in the endodermal cells of the anterior gut (arrow). A, atrium; EC, endocardium; MC, myocardium; V, ventricle. Scale bars: 100 μm in C-H,K,L; 50 μm in I; 20 μm in J.
Image
Figure Caption
Figure Data
Acknowledgments
This image is the copyrighted work of the attributed author or publisher, and
ZFIN has permission only to display this image to its users.
Additional permissions should be obtained from the applicable author or publisher of the image.
Full text @ Development

