Fig. 5
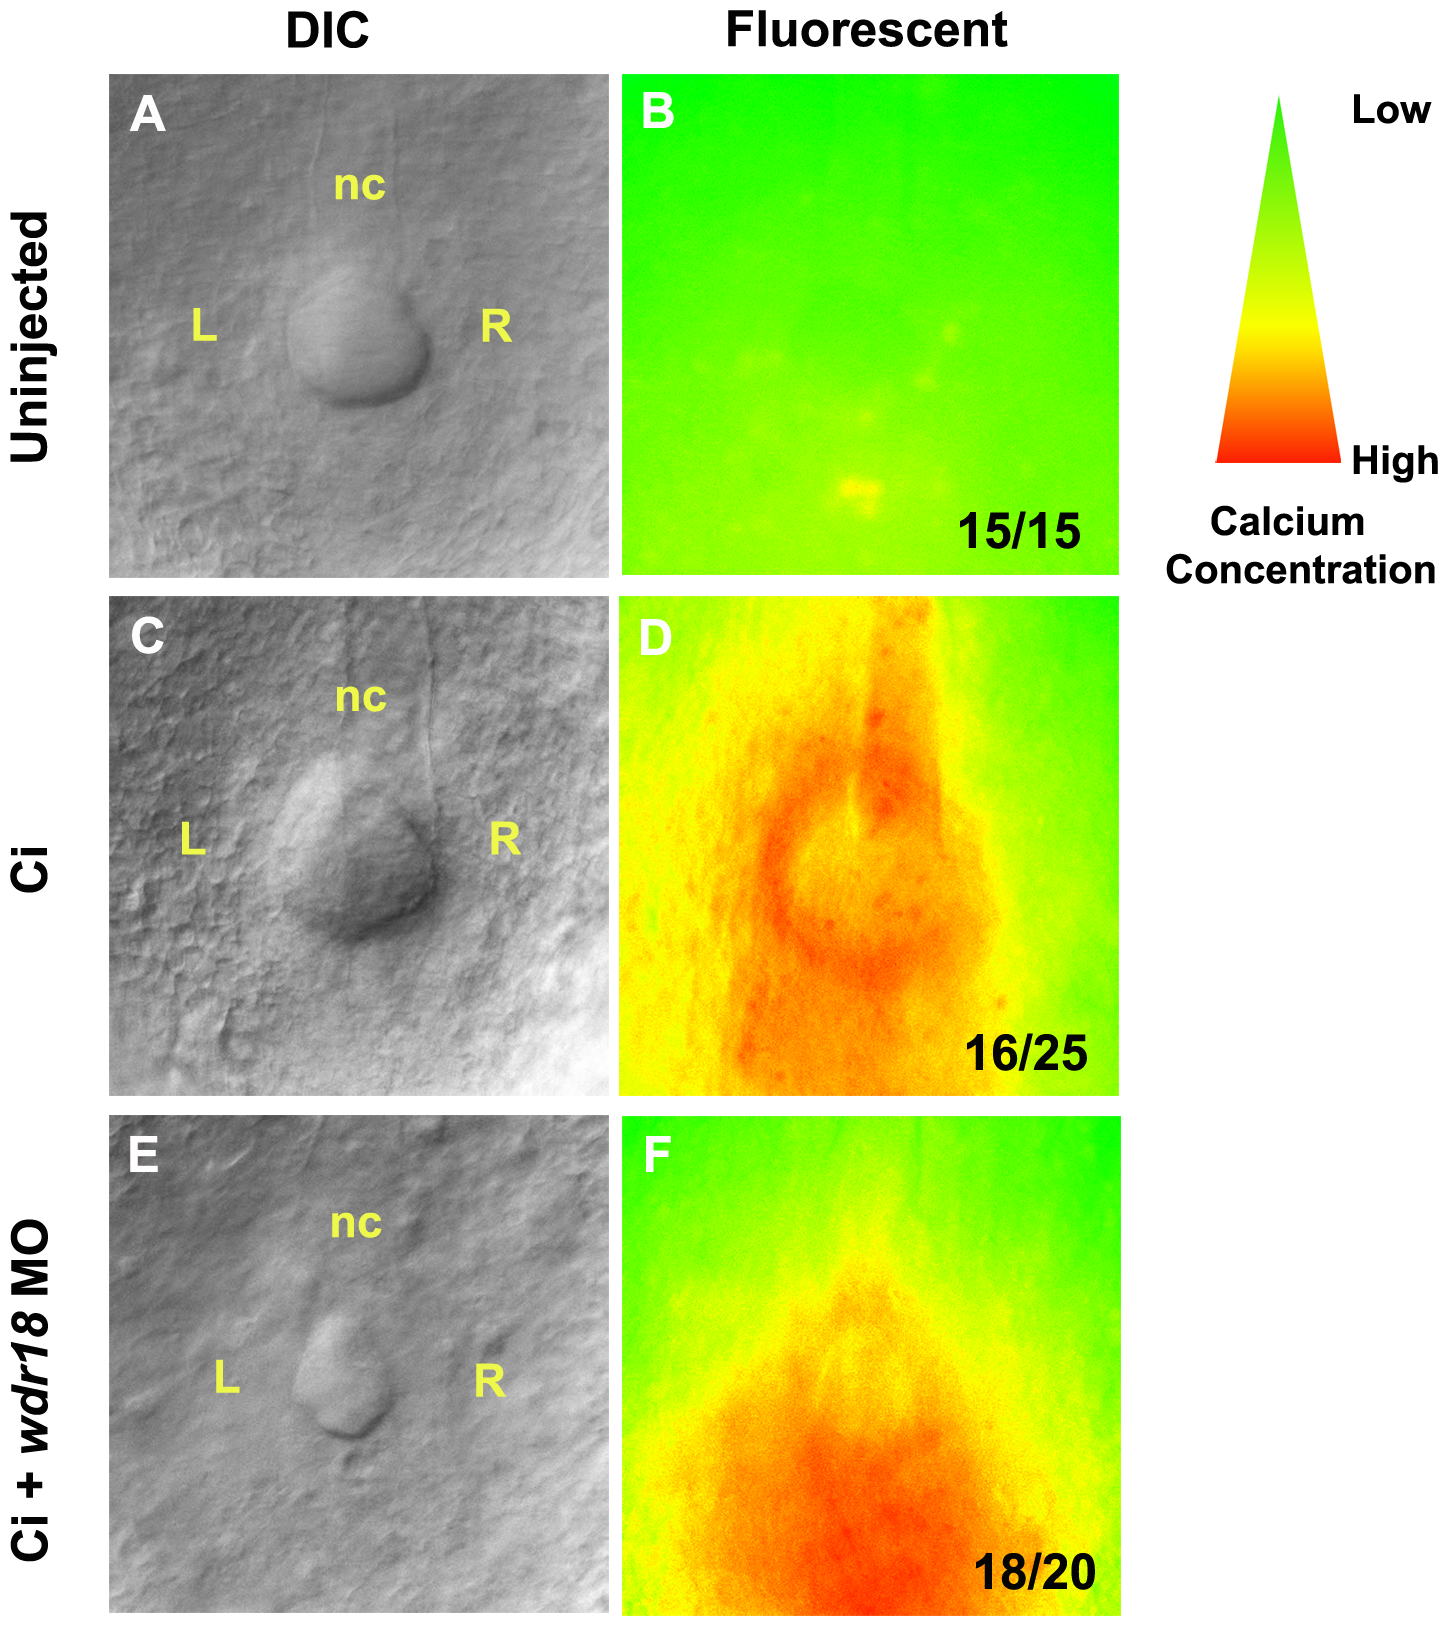
Correct Ca2+ distribution in the KV during early somite stages requires wdr18.
(A?F) Embryos were injected at the 1-cell stage with Ca2+ indicator (Ci) or co-injected with wdr18 MO1. Ca2+ patterns at the 5- to 8-somite stage were imaged by fluorescence microscopy and the images were converted to an intensity scale (colors from red to green indicate intensity from high to low). (A, B) The autofluorescent image of an un-injected control embryo (B) with its corresponding DIC image (A). (C, D) A control embryo injected with Ca2+ indicator only, showing fluorescence in the KV with elevated signals on the left side. (E, F) An embryo co-injected with Ca2+ indicator and wdr18 MO1. The KV is smaller and the fluorescence signal is evenly distributed throughout the KV. nc: notochord. The ratio shown in the lower right corner of B, D and F indicate the number of defective embryos versus total embryos.

