
|
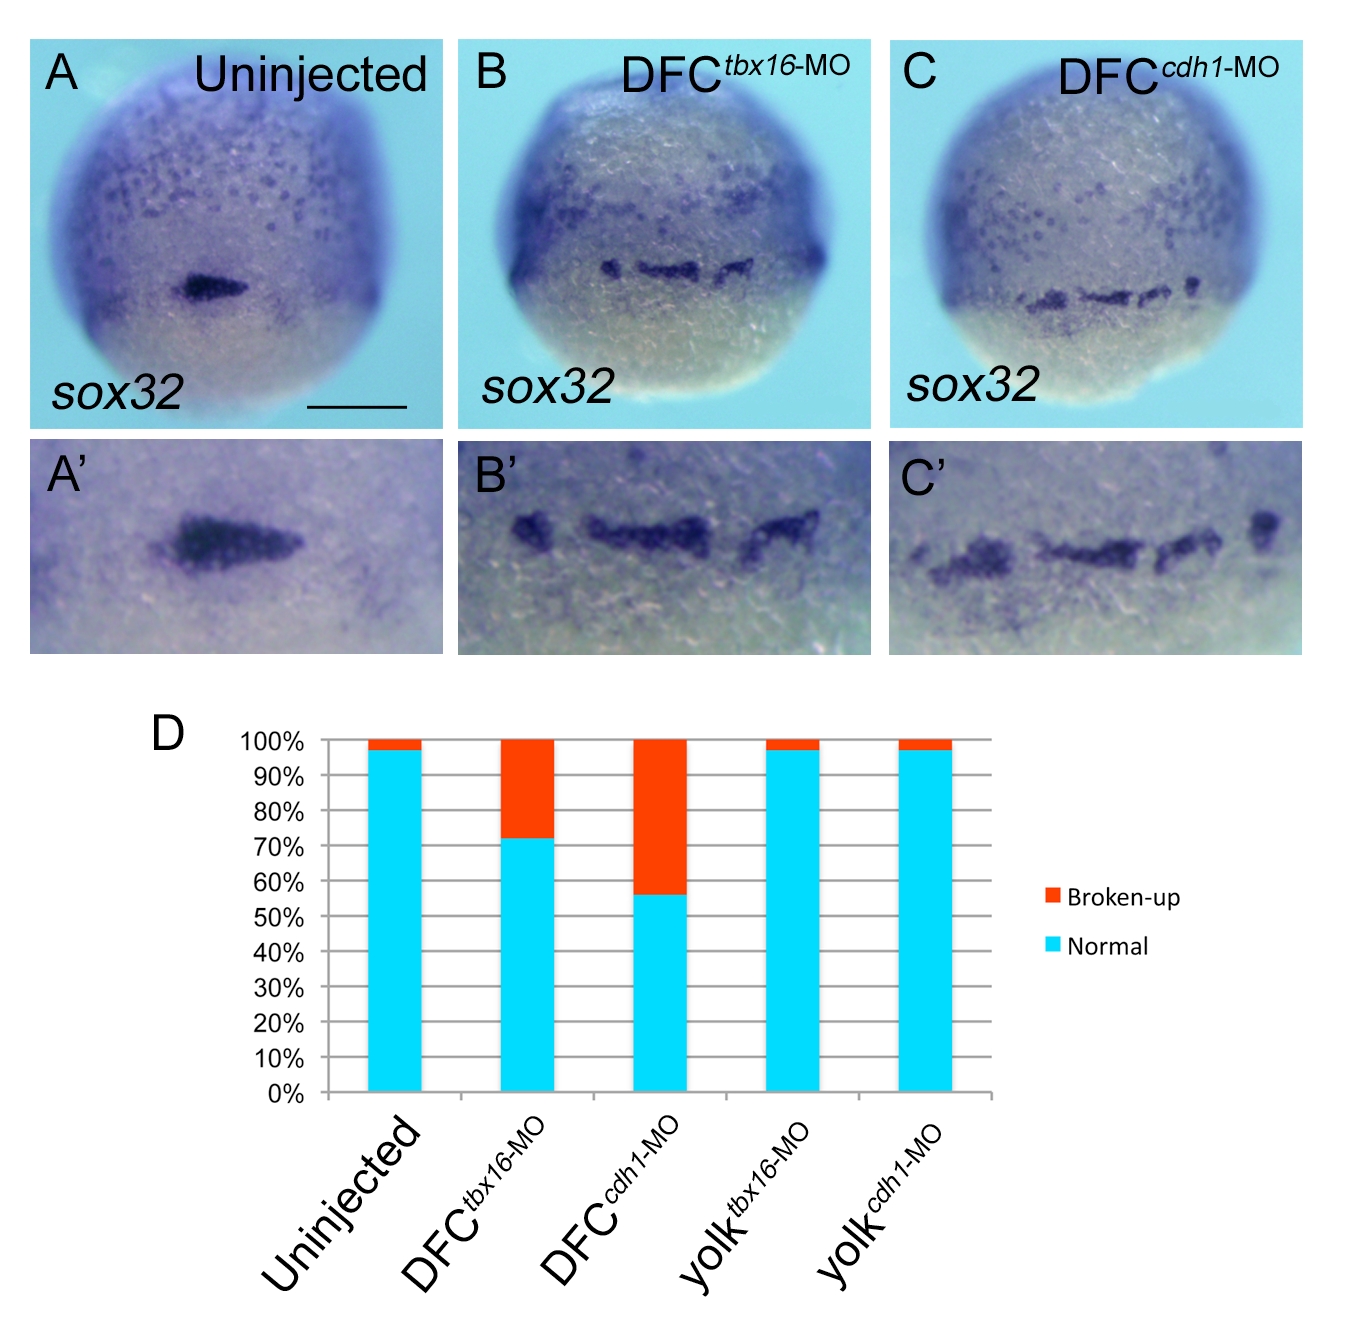
Fig. S11
DFC-specific knockdown of tbx16 or cdh1 results in the broken-up DFC phenotype. (A-C) Dorsal view of sox32 expression in uninjected (A), DFCtbx16-MO (B) or DFCchd1-MO (C) embryos at 65% epiboly stage. Dorsal view, anterior to the top. Scale bar: 200 μm. (D) Percentages of normal or broken-up DFCs were scored using the sox32 expression pattern in uninjected (n = 64), DFCtbx16-MO (n = 55), DFCcdh1-MO (n = 69) yolktbx16-MO (n = 61) and yolkcdh1-MO (n = 65) embryos. Statistically significant (P < 0.05) differences could be seen in uninjected versus DFCtbx16-MO (P = 1.68 x 10⁻⁴) and DFCcdh1-MO (P = 1.17 x 10⁻⁸), but not between uninjected and yolktbx16-MO (P = 1.00) or yolkcdh1-MO (P = 1.00).