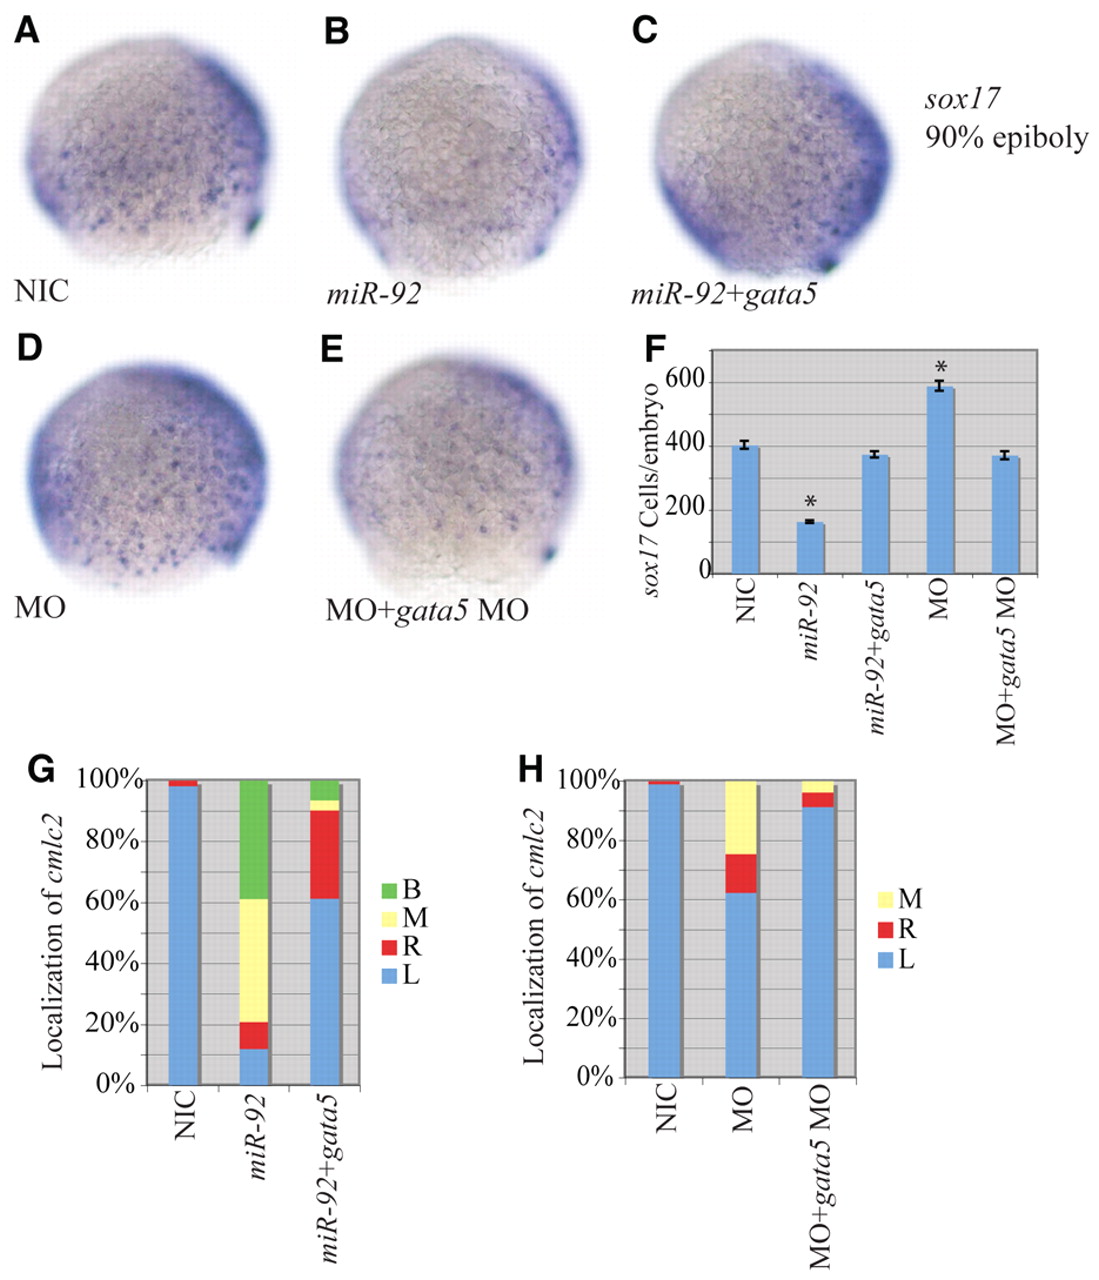
Fig. 5 Epistatic interaction between miR-92 and gata5. (A-E) Localization of sox17-expressing cells in wild-type and variously injected zebrafish embryos at 90% epiboly. MO refers to miR-92 MO. Views are lateral with dorsal to the right. (F) Numbers of sox17-expressing cells in NICs (n=4), miR-92 gain-of-function (n=4), miR-92 and gata5 co-injected (n=7), miR-92 loss-of-function (n=4) and miR-92 MO and gata5 MO co-injected (n=7) embryos. Error bars represent s.e.m. *, P<0.01 between injected embryos and NIC; Student′s t-test. (G) Percentages of left (L), right (R), midline (M) and bilateral (B) localized cmlc2 in NIC (n=112), miR-92 gain-of-function (n=67) and miR-92 and gata5 co-injected (n=31) embryos. (H) Percentages of left, right, midline and bilateral localized cmlc2 in NIC (n=97), miR-92 loss-of-function (n=61) and miR-92 MO and gata5 MO co-injected (n=81) embryos.
Image
Figure Caption
Acknowledgments
This image is the copyrighted work of the attributed author or publisher, and
ZFIN has permission only to display this image to its users.
Additional permissions should be obtained from the applicable author or publisher of the image.
Full text @ Development

