
|
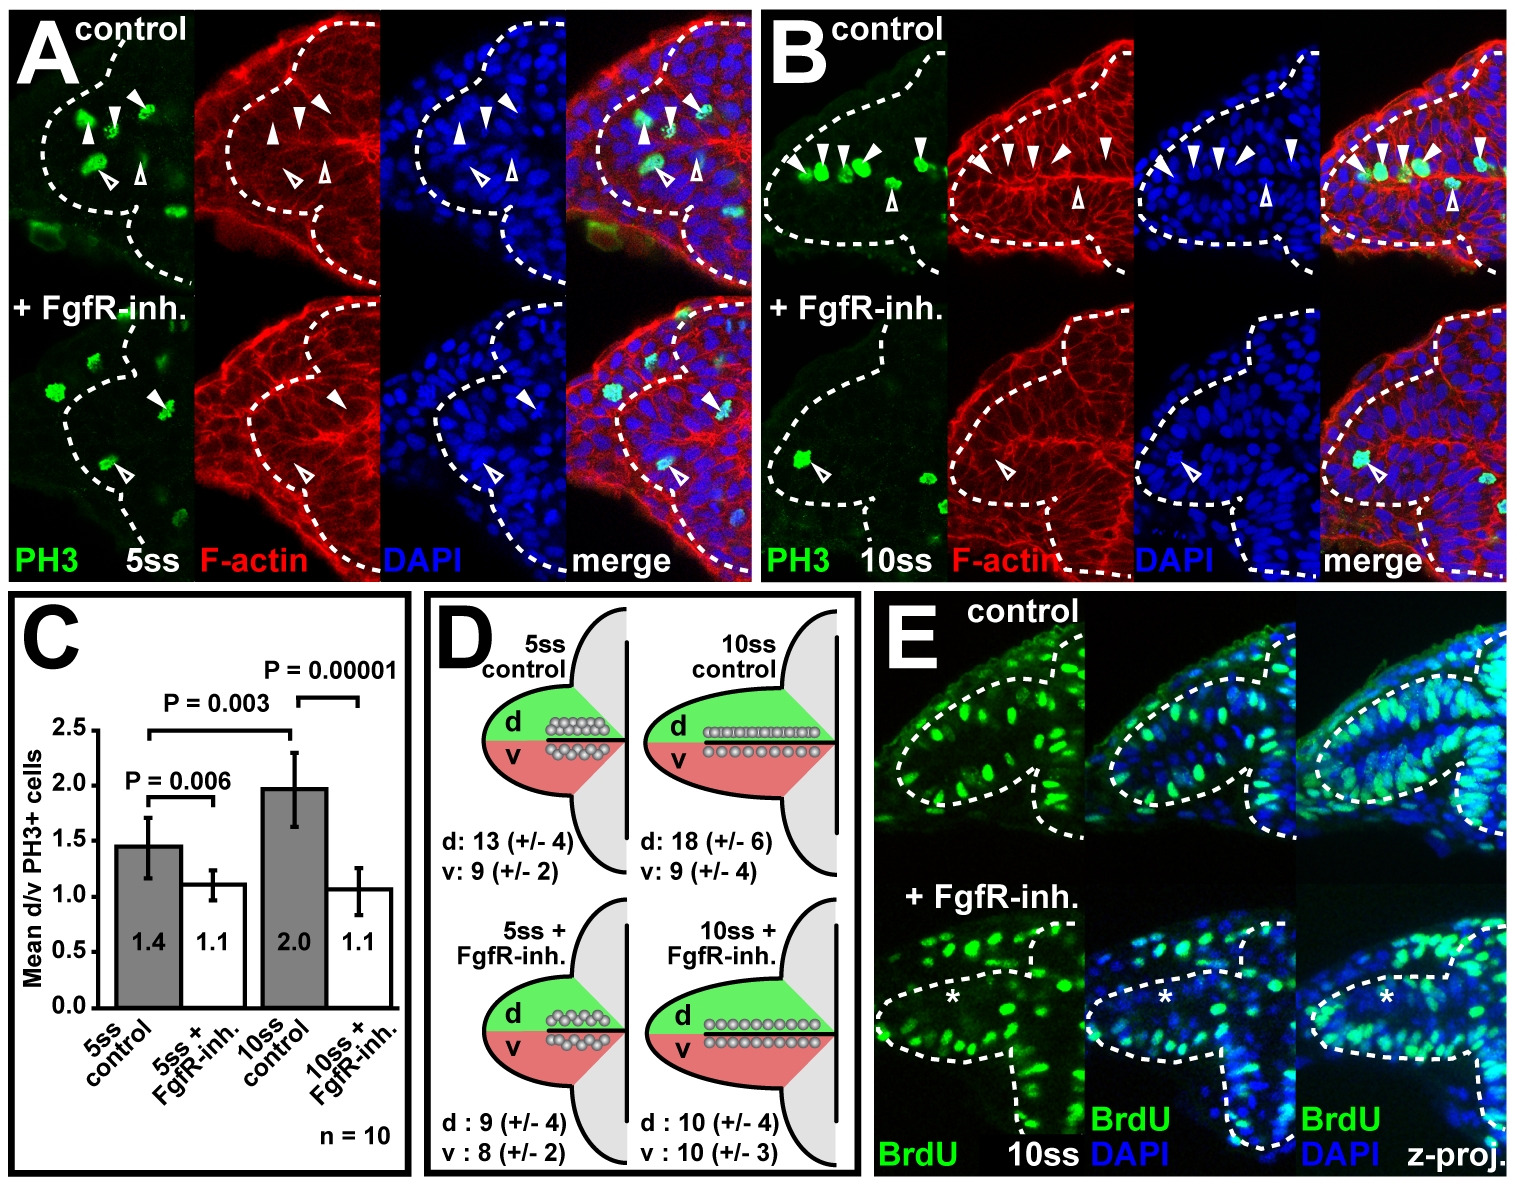
Fig. 2 Fgf signaling controls enhanced nasal retina progenitor proliferation.
(A and B) Detection of mitotic cells with anti-Phospho Histone H3 (PH3, green), counterstained for cortical F-actin (red) and cell nuclei with DAPI (blue) in the optic vesicle of carrier-treated wt control (top) and FgfR-inh.-treated embryos (bottom) at 5ss (A) and 10ss (B) (filled arrowheads: dorsal leaflet cells, open arrowheads: ventral leaflet cells). (C) Quantification of PH3+ cell numbers in the optic vesicle. Mean ratios of mitotic cells in the dorsal (d) and ventral (v) optic vesicle leaflets (mean d/v PH3+ cells, y-axis) for control (grey) and FgfR-inh.-treated embryos (white) at 5- and 10ss (error bars: standard deviation). (D) Schematic plotting of the mean number of PH3+ cells/optic vesicle dorsal and ventral leaflet (complete anterior-posterior extent of the optic vesicle) into one plane (�standard deviation in brackets). (E) Anti-BrdU staining (green) to detect the proliferation pattern in the optic vesicle at 10 ss in carrier-treated wt control (top) and FgfR-inh.-treated embryos (bottom). Cell nuclei are counterstained with DAPI (blue) (asterisks: reduction in BrdU incorporation, left and middle: single optical sections, right: z-projection). Orientation: cross-sections through one half of the forebrain, dorsal to the top and lateral to the left. Dotted lines in (A, B and E): neural tube boundary.