
Image
|
Figure Caption
Fig. 2
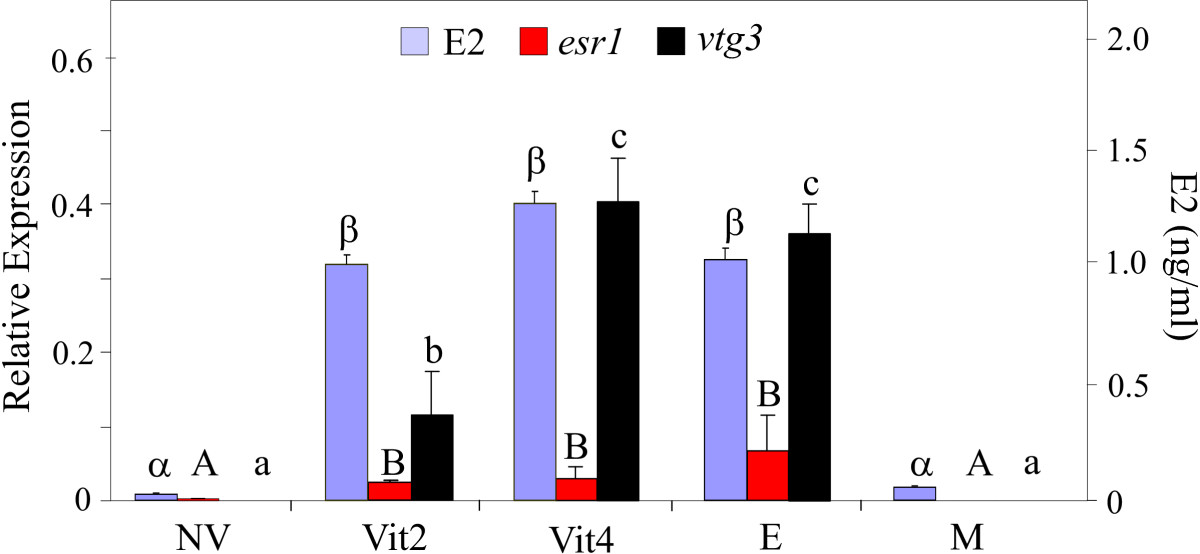
Plasma levels of E2 and expression ratios of esr1 and vtg3 tested by RT-PCR. Gene expression levels were normalized to ef1a and expressed as Mean +SD (n = 3 pools). The letters � and β indicate significant differences in the E2 levels. The letters A, B and a, b, c denote significantly different expression levels of esr1 and vtg3, respectively. E- E2-treated males, Vit2 or Vit4- 2- or 4-month old vitellogenic females, respectively, NV- Non-vitellogenic females, M- control males.
Figure Data
Acknowledgments
This image is the copyrighted work of the attributed author or publisher, and
ZFIN has permission only to display this image to its users.
Additional permissions should be obtained from the applicable author or publisher of the image.
Full text @ BMC Genomics