
|
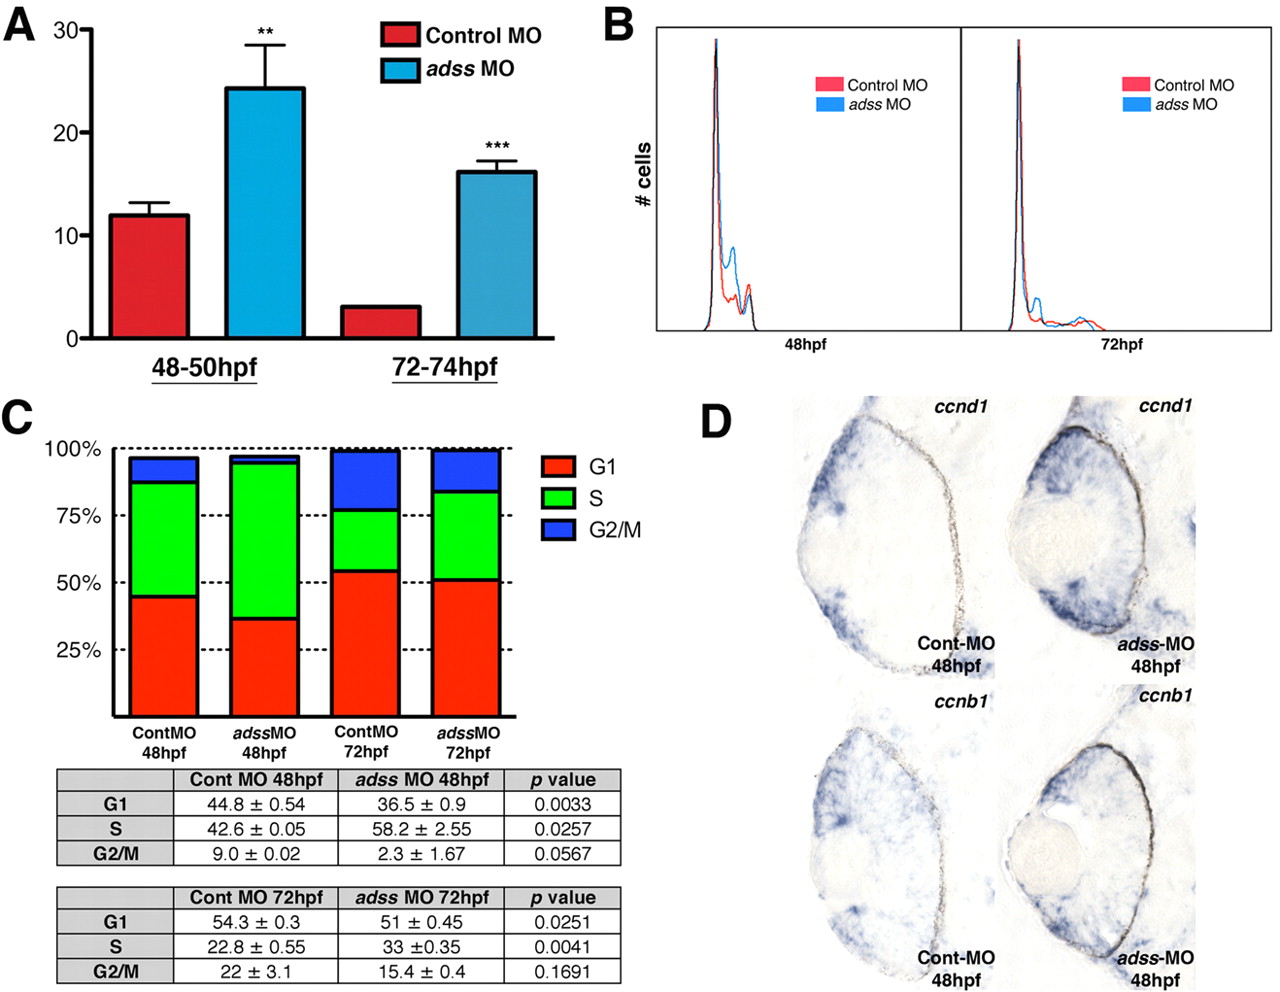
Fig. 10 The ATP pathway is required for S-phase progression. (A) BrdU exposures 48-50 hpf and 72-74 hpf indicate a higher proportion of S-phase cells (y-axis) in adss morphants (** P<0.05, *** P<0.005). (B) DNA content analysis plots from flow cytometry at 48 hpf and 72 hpf. (C) Graphical and tabular data for percentage of cells in G1, S or G2/M, as determined by flow cytometry. adss morphants possess elevated percentages of cells in S phase and decreased percentages in G1. (D) ccnd1 expression is expanded into the central retina of adss morphants when compared with control MO-injected embryos. ccnb1 distribution is normal.