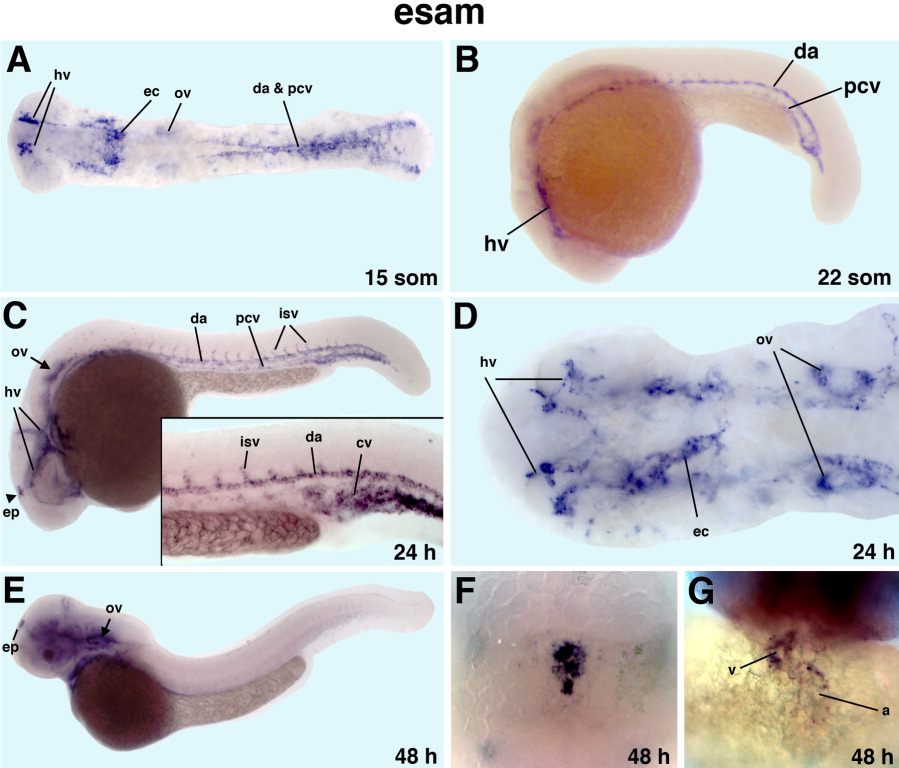
Fig. 3 Expression of endothelial cell-specific adhesion molecule (ESAM) as analyzed by in situ hybridization. A,D: Dorsal view, anterior is to the left. B,C,E: Lateral view, anterior is to the left. A-C: A flat-mounted 15-somite embryo (A), whole-mounted 22-somite (B), and 24 hours postfertilization (hpf; C) embryos; higher magnification view of the tail region (inset in C). D-G: Anterior region of a flat-mounted 24 hpf embryo (D), 48 hpf stage embryos (E-G), views of esam expression in epiphysis (F) and heart (G). A,B: Note esam expression in the progenitors of head vessels (hv), endocardium (ec), dorsal aorta (da), and posterior cardinal vein (pcv), as well as nonvascular expression in the otic vesicle (ov). C-E,G: Esam is expressed in the axial, intersegmental (isv), and head vessels (C); and in the dorsal longitudinal vessel, aortic arches, and endocardial cells of the atrium (a) and the ventricle (v; D,E,G). C,E,F: In addition, esam is expressed in the otic vesicle (arrows, C,E) and a subset of neurons in the brain region including epiphysis (ep; C,E,F).
Image
Figure Caption
Figure Data
Acknowledgments
This image is the copyrighted work of the attributed author or publisher, and
ZFIN has permission only to display this image to its users.
Additional permissions should be obtained from the applicable author or publisher of the image.
Full text @ Dev. Dyn.

