
|
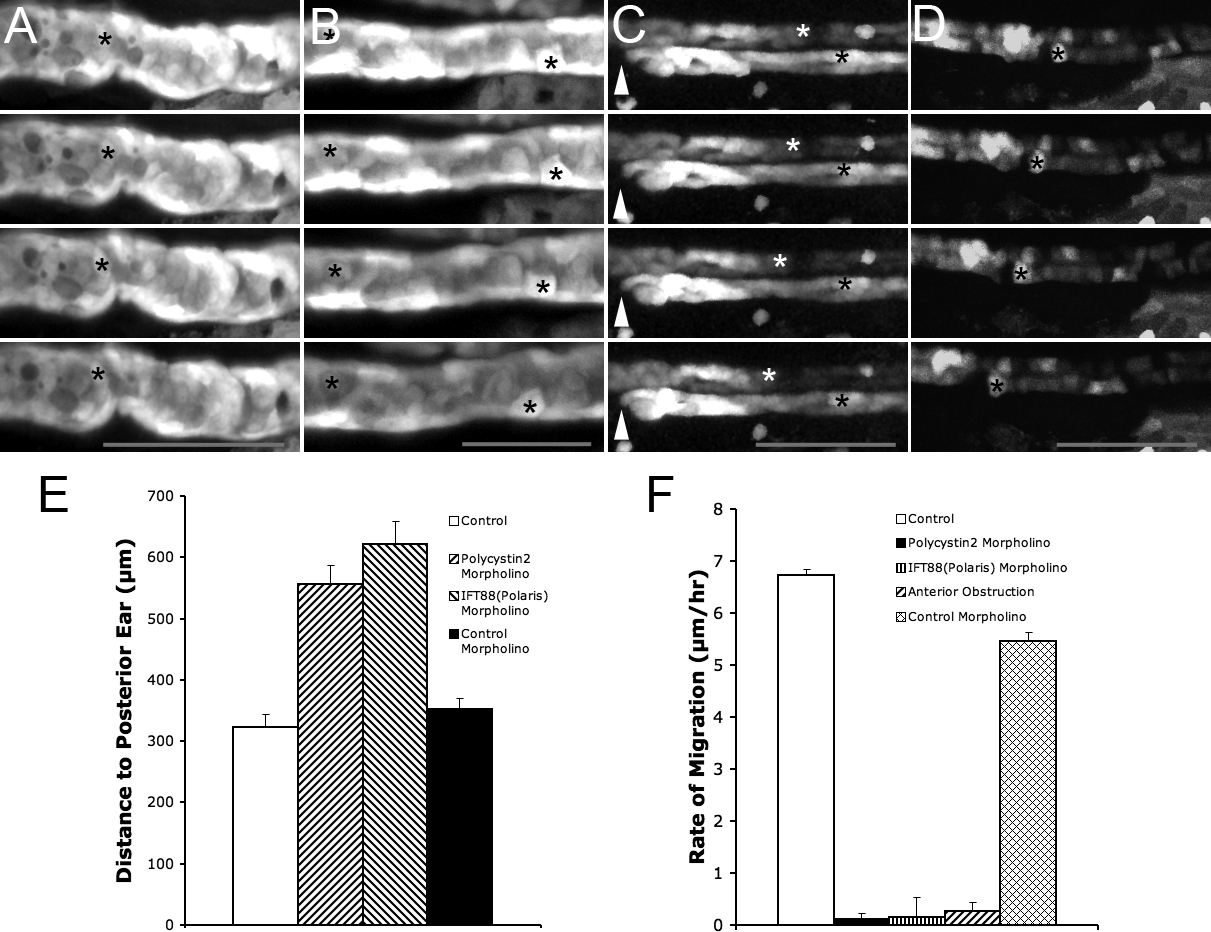
Fig. 7 Decreasing Pronephric Fluid Flow Suppresses Anterior Migration
(A?D) Time-lapse frames of ET33-D10 GFP transgenics, 2.5 dpf. Time interval between frames is 2.5 h, scale bar: 80 μm (in bottom frame).
(A) polycystin2 morphant embryo; asterisk marks stationary cell in the pronephros.
(B) ift88 (polaris) morphant embryo; asterisks mark stationary cells in the pronephros.
(C) Anterior (proximal) obstruction; arrowhead marks position of unilateral anterior obstruction; white asterisk marks a migrating cell in the unobstructed nephron; black asterisk marks stationary cell in the obstructed nephron.
(D) Control morpholino injected embryo showing normal rate of proximal cell migration (asterisk marks a migrating cell).
(E) Measurement of proximal nephron segment shortening in ET33-D10 GFP transgenics (shorter lengths indicate further proximal progression as described in Figure 5E). From left to right: Control uninjected embryos (n = 36); polycystin2 morphant embryos (n = 20); ift88 (polaris) morphant embryos (n = 10); Control morpholino injected embryos (n = 17)
(F) Rates of proximal cell migration, from left to right: Control; polycystin2 morphant embryo; ift88 (polaris) morphant embryo; anterior obstruction; Control morpholino.