
|
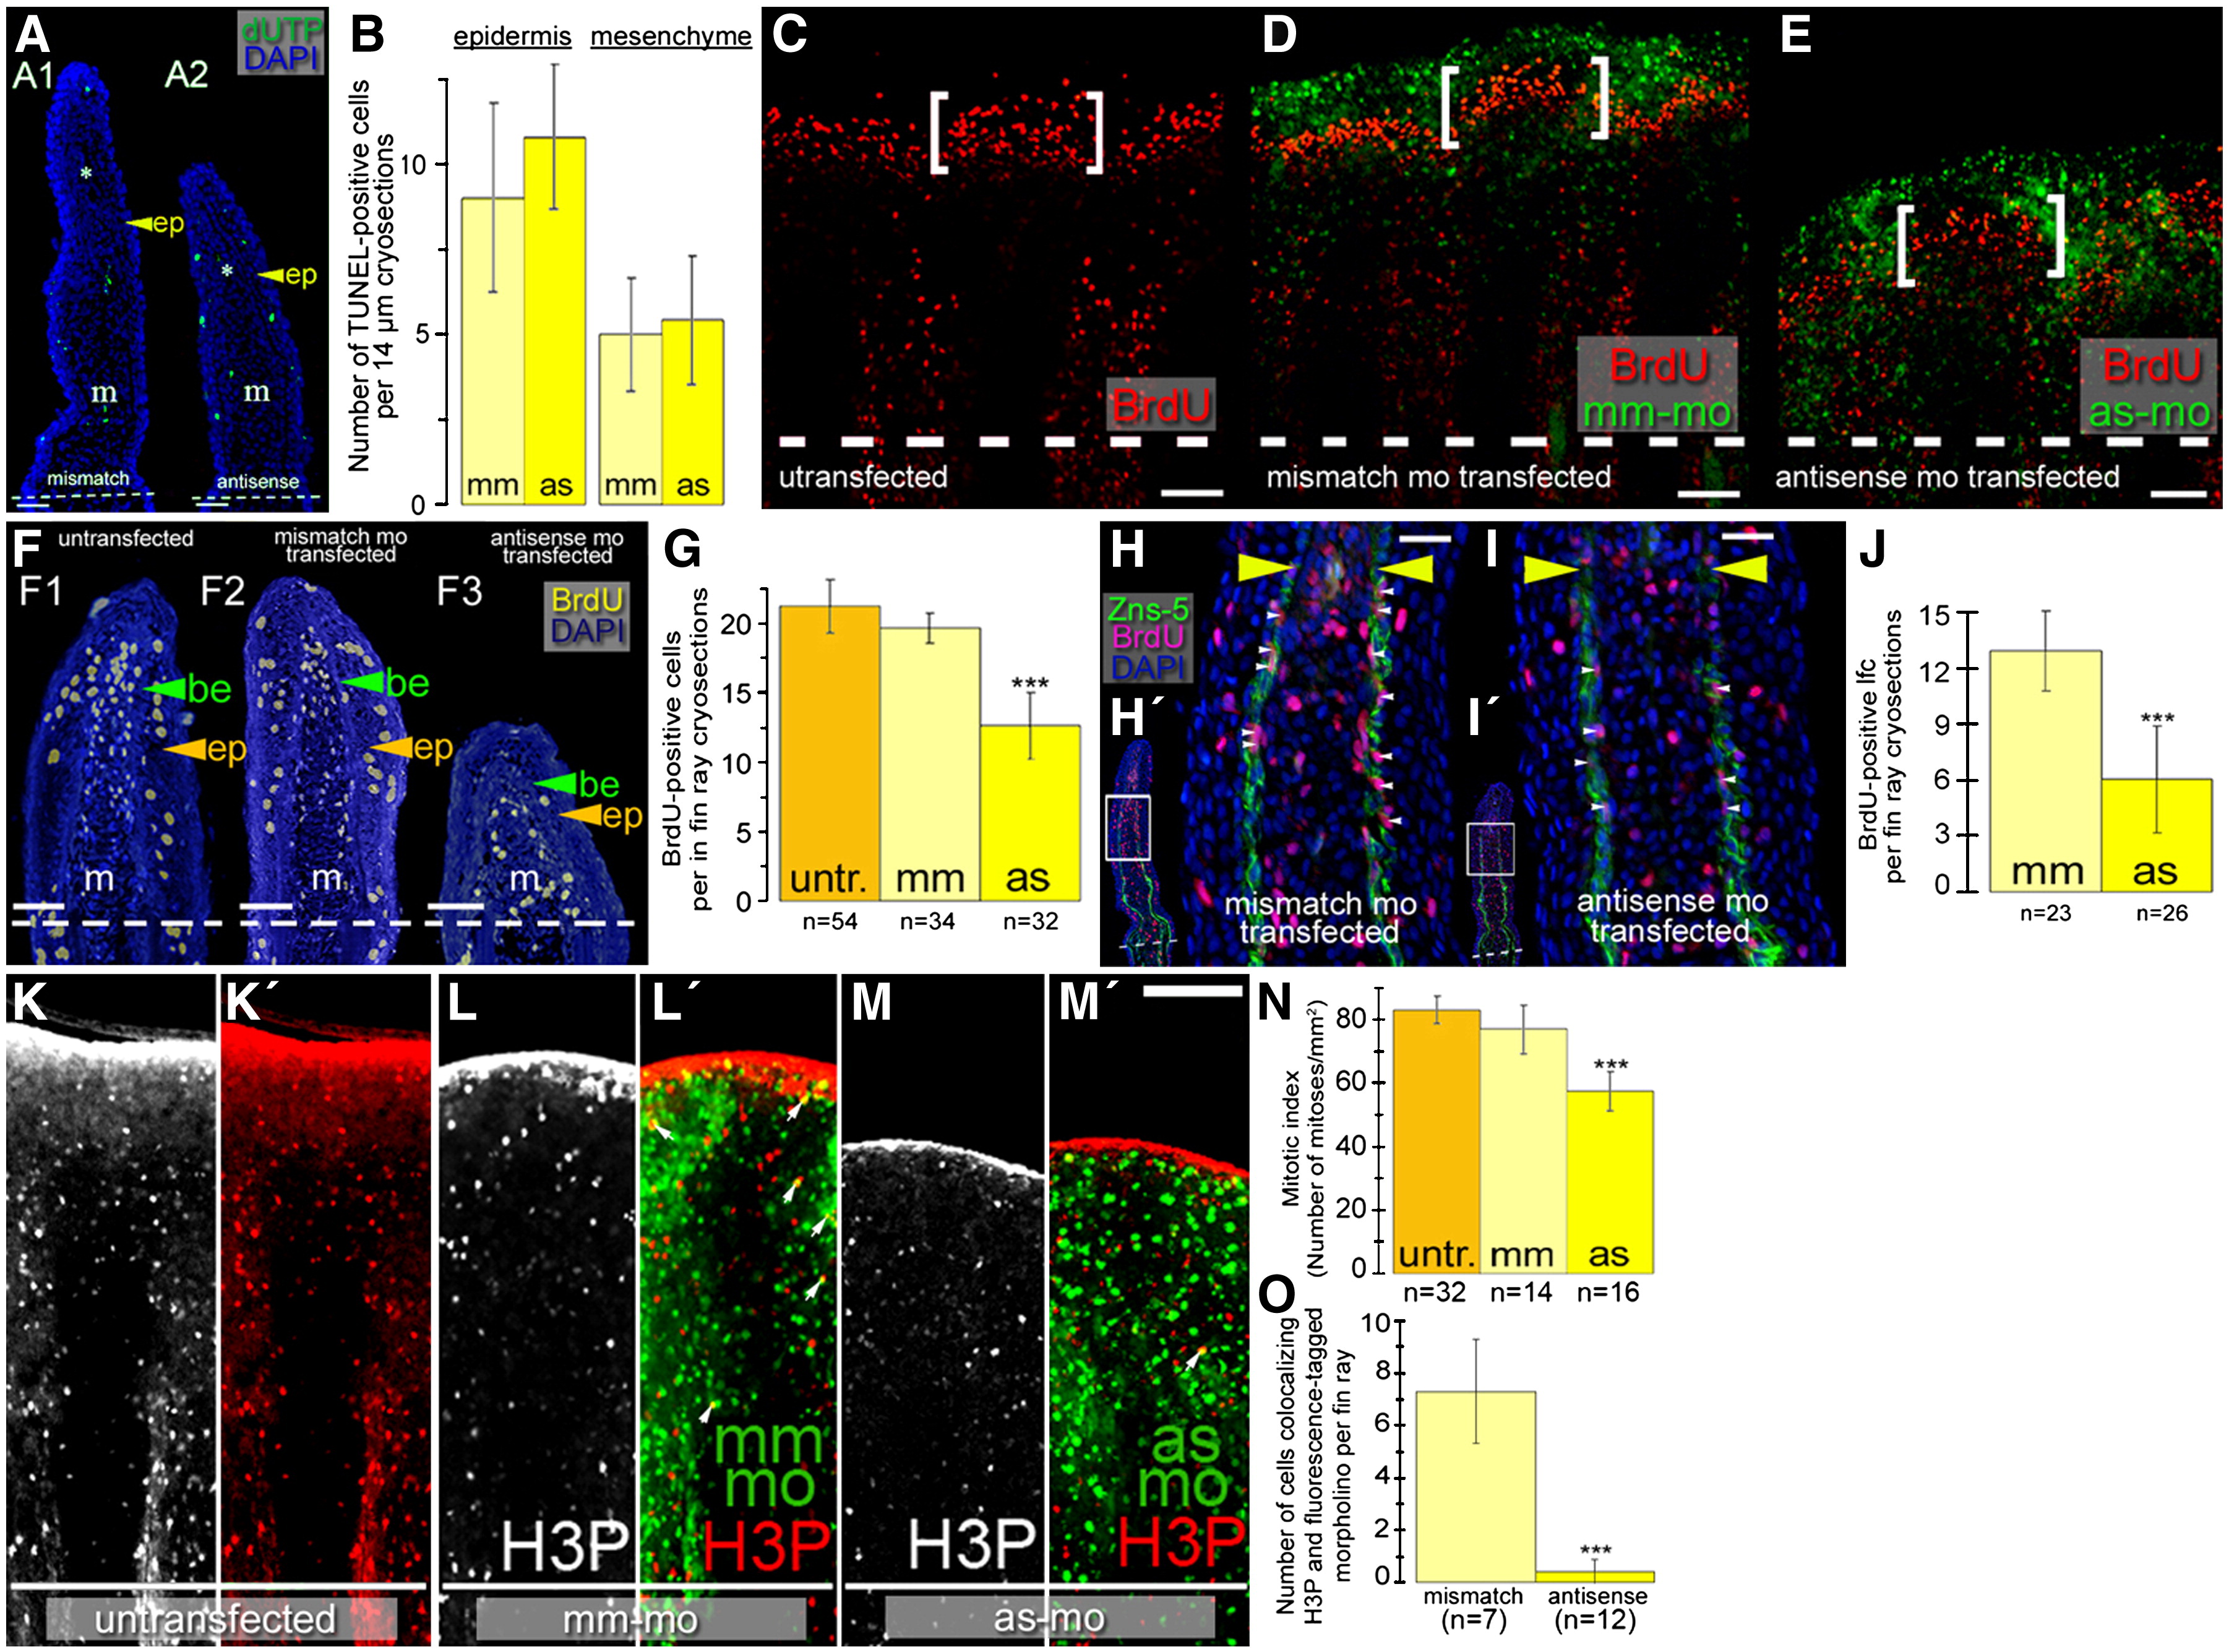
Fig. 8 smp knockdown results in reduced BrdU incorporation and histone H3 phosphorylation in cells of the regenerating fin. (A) TUNEL labeling (green fluorescence) of untransfected (A1) and antisense morpholino-transfected (A2) fins. DAPI staining (blue fluorescence) labeled nuclei. (B) Graph shows the average number of TUNEL positive nuclei. Twenty-eight cryosections for TUNEL-assay were analyzed. Scale bar equals 25 μm. Confocal fluorescence imaging of Cy3-labeled BrdU and fluorescein-labeled morpholinos in untransfected (C), mismatch-morpholino-transfected (D), and antisense-morpholino-transfected (E) regenerating fins 3 dpa. BrdU labeling in coronal sections through regenerating lobes of untransfected (F1), mismatch morpholino-transfected (F2) and antisense morpholino-transfected (F3) fins. (G) Graph shows the number of BrdU-positive cells per 14 μm section of untransfected (untr.), mismatch-morpholino-transfected (mm) and antisense-morpholino-transfected (as) fins. (H,I) Immunohistochemistry for the extracellular matrix of scleroblasts (Zns-5, green), Cy3-labeled BrdU-positive nuclei (red) and DAPI-labeled nuclei (blue). Yellow arrowheads mark the most distal localization of Zns-5 staining. White arrowheads highlight BrdU-incorporated scleroblasts. (H′, I′) Panels show entire stained fin and white boxes show region where the larger panels are located. (J) Graph shows the number of Zns-5 and BrdU double positive cells in fins transfected with mismatch and antisense morpholinos. Panels show fluorescent detection of Cy3-labeled histone H3 phosphorylated nuclei alone in untransfected (K), mismatch-morpholino-transfected (L) or antisense-morpholino-transfected (M) or merged with fluorescein-labeled morpholinos: untransfected (L′), mm-mo-transfected (L′), or as-mo-transfected (M′). (N) Graph shows the number of mitoses per mm2 in untransfected (untr.) control, mm-mo-transfected control and as-mo-transfected fins. (O) Graph depicts the number of doubly stained cells for Cy3 (H3P) and fluorescein (morpholino). Scale bars represent 100 μm in C?E and K?M′; 50 μm in F, and 25 μm in H and I. (m: mesenchyme, be: basal epithelium, ep: epithelial layers.) (***: p < 0.001, Student's t-test).
Reprinted from Developmental Biology, 325(2), Kizil, C., Otto, G.W., Geisler, R., N�sslein-Volhard, C., and Antos, C.L., Simplet controls cell proliferation and gene transcription during zebrafish caudal fin regeneration, 329-340, Copyright (2009) with permission from Elsevier. Full text @ Dev. Biol.