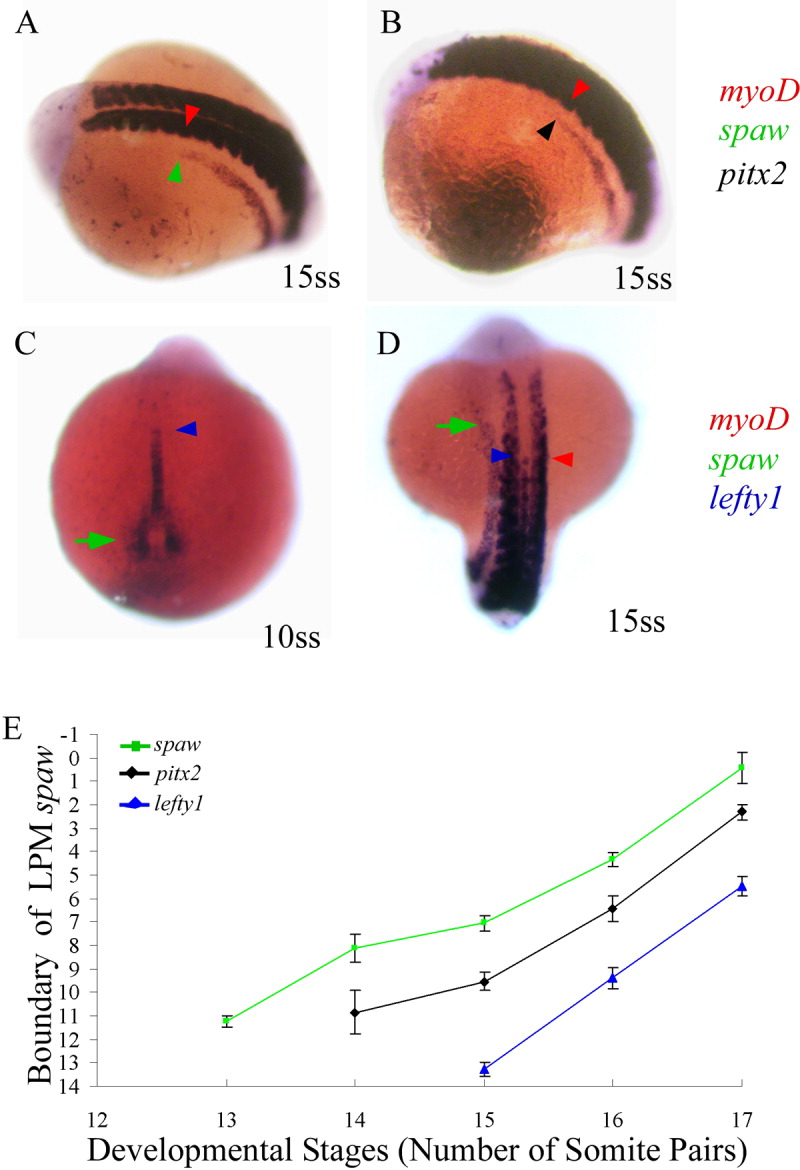
Fig. 1 Quantification of the posterior to anterior propagation of spaw, pitx2 and lft1. A: At 15 somite stage (SS), the anterior boundary of lateral plate mesoderm (LPM) spaw was at somite 7. Green arrowhead: anterior expression boundary of spaw. Red arrowhead: somite corresponding to the anterior expression boundary of spaw, pitx2 or lft1. B: At 15 SS, the anterior boundary of LPM pitx2 expression was at somite 10. C,D: lft1 expression in the midline was bi-phasic. C: In the first phase, static lft1 expression was present in posterior midline before the LPM spaw expression at 10 SS. D: At approximately 15 SS, the second propagation phase of lft1 expression started. Green arrow: spaw expression. Blue arrowhead: anterior expression boundary of lft1 expression. A,B: Anterior to the left. C,D: Anterior to the top. E: Quantitative analysis of posterior-to-anterior (PA) propagation of spaw (n = 213), pitx2 (n = 74) and lft1 (n = 124). X axis is the development stages defined by total number of somite pairs. Y axis is the position of anterior expression boundary of each gene. A negative number means the anterior expression domain is anterior to the somitogenesis region. Almost 100% of embryos had detectable expression of spaw and pitx2 at stage 13 SS, 14 SS, respectively. Error bars are ± standard error.
Image
Figure Caption
Figure Data
Acknowledgments
This image is the copyrighted work of the attributed author or publisher, and
ZFIN has permission only to display this image to its users.
Additional permissions should be obtained from the applicable author or publisher of the image.
Full text @ Dev. Dyn.

