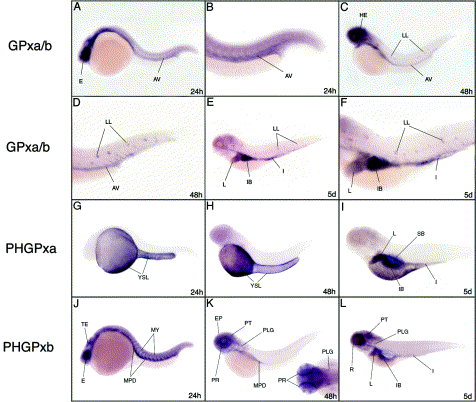
Fig. 2 Expression patterns of the glutathione peroxidase (A?F) and phospholipid hyperoxide glutathione peroxidases (G?L) during development in zebrafish embryos. Development stage is indicated in the right lower corner in hours (h) or days (d) post-fertilization. AV, axial vasculature; E, eye; EP, epiphysis; HE, head; I, intestine; IB, intestinal bulb; L, liver; LL, lateral line; MPD, medial part of the pronephric duct; MY, myotomes; PLG, posterior lateral line ganglion; PR, photoreceptor cell layer of the retina; PT, posterior tectum; R, retina; SB, swim bladder; TE, tectum; YSL, yolk syncytial layer.
Reprinted from Gene expression patterns : GEP, 3(4), Thisse, C., Degrave, A., Kryukov, G.V., Gladyshev, V.N., Obrecht-Pflumio, S., Krol, A., Thisse, B., and Lescure, A., Spatial and temporal expression patterns of selenoprotein genes during embryogenesis in zebrafish, 525-532, Copyright (2003) with permission from Elsevier. Full text @ Gene Expr. Patterns

