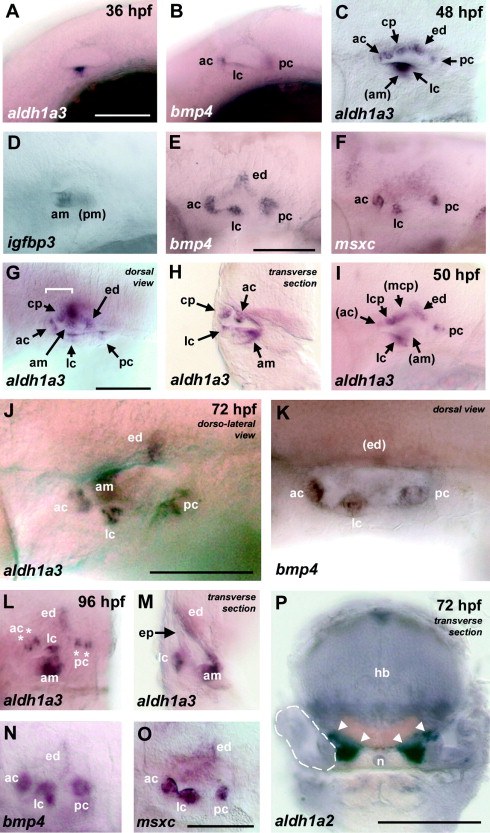
Fig. 4
Fig. 4 Expression of aldh1a3 in the inner ear. aldh1a3 expression (A, C, G?J, L, M), in comparison to the expression of bmp4 (B, E, K, N), msxc (F, O) igfbp3 (D) and aldh1a2 (P), was detected by whole mount in situ hybridisation in the zebrafish inner ear from 26 hpf to 96 hpf. Weak expression of aldh1a3 is visible in the ventral part of the otic vesicle at 26 hpf and 36 hpf (not shown and A). At 36 hpf weak expression of bmp4 in the otic vesicle marks the anterior (ac), lateral (lc) and posterior cristae (pc) (B). At 48 hpf aldh1a3 is detectable in the cristae, the endolymphatic duct (ed), the anterior macula (am), and the cranial epithelial projection (cp) (C; G, dorsal view, bracket indicates extent of section in H; H, transverse section through the otic capsule). Inner ear structures were identified by comparison to igfbp3, which marks the anterior and the posterior macula (pm, out of focus) (D), and to bmp4 and msxc, which show strong expression in the cristae, bmp4 additionally in the endolymphatic duct (E and F). Expression in the cranial epithelial projection at 50 hpf is visible on the lateral (lcp) and medial (mcp) surface of the projection (I, dorso-lateral view with superficial focus on the lateral cranial projection). At 72 hpf, aldh1a3 was detected in the anterior macula and in two opposing sectors within each of the cristae (J, dorso-lateral view), while bmp4 appears to be more widely expressed in these organs (K, dorso-lateral view). Like bmp4, aldh1a3 expression persists in the endolymphatic duct (J, K). Expression of aldh1a3, bmp4 and msxc persists largely unchanged until 96 hpf, when the partition of the aldh1a3 expression domains in the cristae becomes evident (asterisks in L; M, transverse section at the level of the lc; N and O). Expression of aldh1a2 is absent from the inner ear at least up until 72 hpf, but present in the periotic mesenchyme (arrowheads in P, transverse section, dashed lines outline the borders of the otocyst). All panels, unless otherwise indicated, are lateral views with anterior to the left. Parentheses indicate structures outside the focal plain. n, notochord. Scale bars, 100 μm.
Reprinted from Gene expression patterns : GEP, 8(3), Pittlik, S., Domingues, S., Meyer, A., and Begemann, G., Expression of zebrafish aldh1a3 (raldh3) and absence of aldh1a1 in teleosts, 141-147, Copyright (2008) with permission from Elsevier. Full text @ Gene Expr. Patterns

