
Image
|
Figure Caption
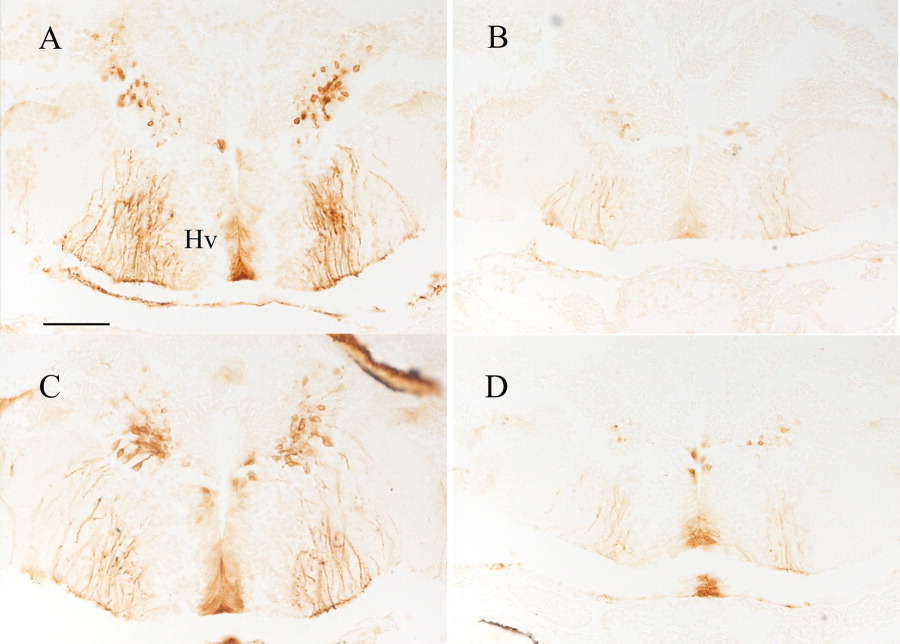
Fig. 4 Differences in CYP19A2 staining intensity among female and male 40 days postfertilization (dpf) zebrafish. Both micrographs depict the area surrounding the ventral zone of the periventricular hypothalamus. A,C: High expression of aromatase in a female (A) and male (C) fish. B,D: Low expression in a female (B) and male (D) 40 dpf fish. Scale bar = 50 μm.
Figure Data
Acknowledgments
This image is the copyrighted work of the attributed author or publisher, and
ZFIN has permission only to display this image to its users.
Additional permissions should be obtained from the applicable author or publisher of the image.
Full text @ Dev. Dyn.