
|
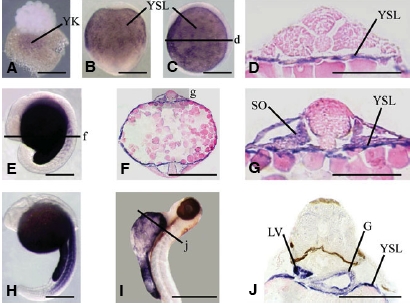
Fig. 3 Expression of gamt in zebrafish embryos. Left side views for the whole mount, except where noted, with anterior up and dorsal to the right. (A) Early cleavage stage, side view. Weak expression was found in the center of the yolk. (B) Bud stage (10 h), ventral view. Expression of gamt appeared in the YSL. (C) 8-somite stage (13 h), showing gamt expression in the YSL. (D) Cross section of (C) through the line d. (E) 15-somite stage (16.5 h); gamt is expressed in the YSL and the mature somites. (F) Cross section of (E) through the line f. (G) Enlargement of the gray shadow area g in (F), showing gamt expression in the YSL and the somites. (H) 25-somite stage (21.5 h), showing increased expression in the somites. (I) Long-pec stage (48 h). (J) Cross section of (I) through the line j. Staining of gamt disappeared in the somites, but persisted in the YSL and appeared in the liver and the gut. G, gut; LV, liver; SO, somite; YK, yolk; YSL, yolk syncytial layer. Scale bar: 80 μm for (G) and 250μm for others.