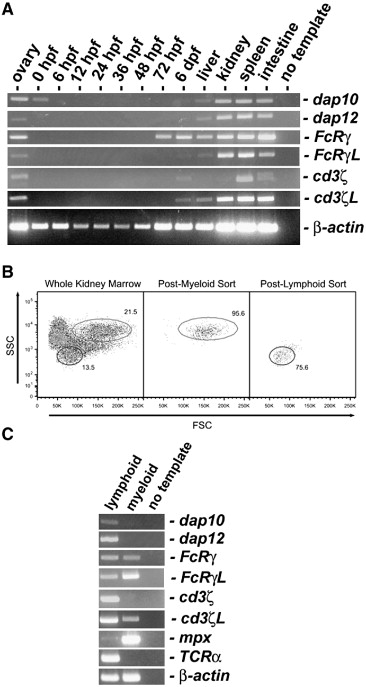
Fig. 4 Detection of adaptor protein expression. (A) RT-PCR was used to detect transcripts of the six zebrafish adaptor proteins, dap10, dap12, FcRγ, FcRγ-like, cd3ζ and cd3ζ-like from embryonic and larval zebrafish including 0 h post fertilization (hpf) through 6 days post fertilization (dpf) as well as from adult tissues (ovary, liver, kidney, spleen and intestine). (B) Myelomonocytic (gray gate) or lymphocytic (black gate) cells were purified from whole kidney marrow based on light scatter characteristics. The scatter profile of zebrafish whole kidney marrow (left) is shown in comparison to post-myeloid (middle) and post-lymphoid (right) sorts using forward (FSC) and side (SSC) scatter. Myeloid and lymphoid cells, which represent ∼ 21.5% and ∼ 13.5% of the whole kidney marrow were purified to ∼ 95.6% and ∼ 75.6% purity, respectively, and used for RT-PCR analyses. (C) RT-PCR was used to assess which adaptor proteins are expressed in the zebrafish lymphoid and myeloid lineages. RT-PCR of mpx provides a positive control for myeloid cells and RT-PCR of TCRα provides a positive control for lymphocytes. μ-actin is shown as a positive control for all RNA samples.
Reprinted from Gene, 401(1-2), Yoder, J.A., Orcutt, T.M., Traver, D., and Litman, G.W., Structural characteristics of zebrafish orthologs of adaptor molecules that associate with transmembrane immune receptors, 154-164, Copyright (2007) with permission from Elsevier. Full text @ Gene

