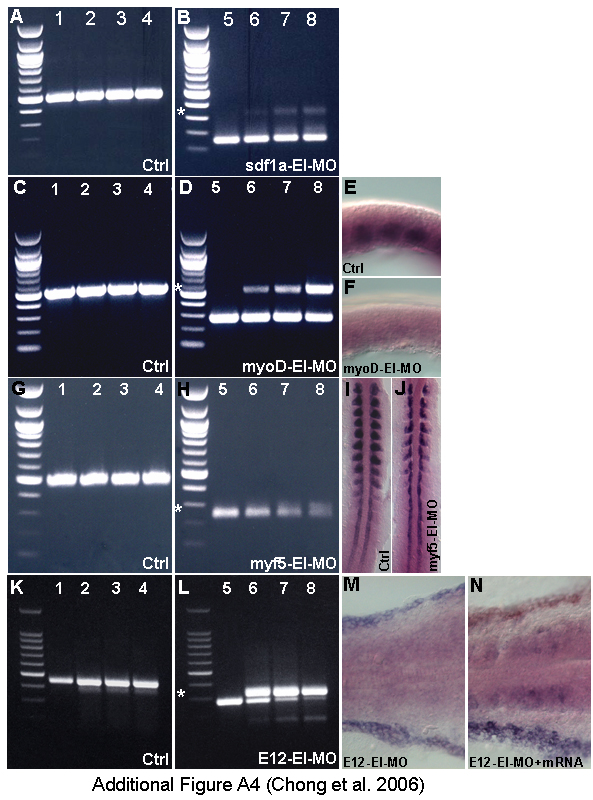
Fig. S4 Efficiency of splice site MOs. (A,C,G,K) β-actin primers used in +RT control. Splice site MOs inhibit splicing in sdf1a (B), myoD (D), myf5 with degradation (H) and e12 (L). Total RNA from control (lane1,5), 0.46 pmole/embryo (lane2,6), 0.92 pmole/embryo (lane 3,7), 2.3 pmole/embryo(lane4,8). Splice product sizes are indicated by white asterisks. (E,F) mylz2 riboprobe staining on control (n = 20/20) and myoD-EI morphant (n = 19/20) respectively [96]. (I,J) myogenin riboprobe staining on control (n = 20/20) and myf5-EI morphant (n = 18/20) respectively [97]. (M,N) sdf1a riboprobe staining on E12-EI morphant (n = 20/20)and morphant rescued with e12 mRNA (n = 10/16).
Image
Figure Caption
Figure Data
Acknowledgments
This image is the copyrighted work of the attributed author or publisher, and
ZFIN has permission only to display this image to its users.
Additional permissions should be obtained from the applicable author or publisher of the image.
Full text @ BMC Dev. Biol.

