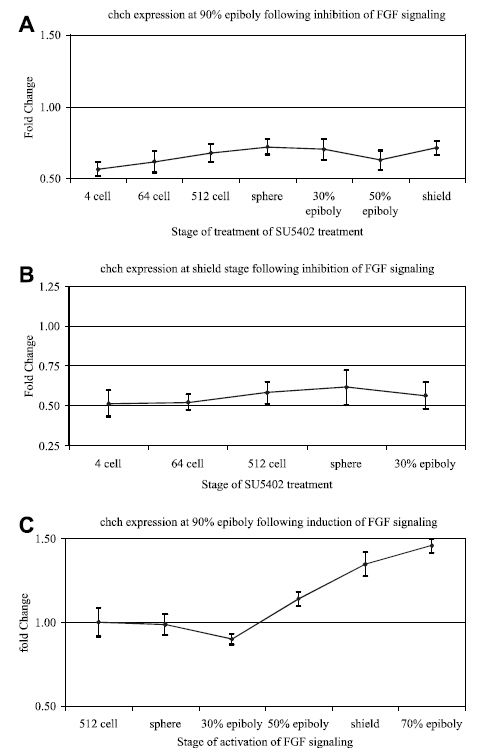
Fig. 4 FGF signaling regulates zebrafish chch expression. To determine if FGF signaling regulates chch gene expression, chch expression was assayed by real-time PCR following inhibition (A–B) or activation (C) of FGF signaling. Wild-type embryos were placed in were treated for 2 h in SU5402 to block FGF signaling at the indicated stage (x-axis) and collected at 90% epiboly (A) or shield stage (B) for real-time PCR. FGF signaling was induced by the addition of AP20187 to iFGFR1 mRNA injected embryos. Embryos were placed in the AP20187 at the indicated stage (x-axis) for 15 min then washed and collected at 90% epiboly for real-time PCR (C). The fold change in chch transcript levels (y-axis) is graphed relative to untreated control embryos (which is set at 1).
Reprinted from Gene expression patterns : GEP, 7(6), Londin, E.R., Mentzer, L., Gates, K.P., and Sirotkin, H.I., Expression and regulation of the zinc finger transcription factor Churchill during zebrafish development, 645-650, Copyright (2007) with permission from Elsevier. Full text @ Gene Expr. Patterns

