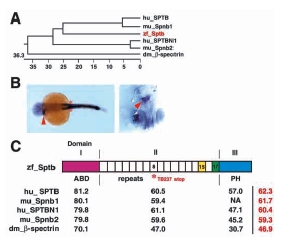
Fig. 5 Phylogeny and sequence comparison of Sptb. (A) Phylogenetic tree of β-spectrin family members from Drosophila melanogaster, zebrafish, mouse and human. Numerical value indicates phylogenetic distance (= sum (residue distance) + (gaps x gaps penalty) + (gap residue x gap length penalty)). Zebrafish sptb is shown in red. (B) Left panel shows dorsal view (4X) of a 23 hpf embryo, with sptb expression in the myotube (arrowhead) and somites (asterisk). Identical staining of ICM, myotube and somites is observed with riboprobes generated from BScd, BF1/238 or BSPH (shown here) clones. Right panel shows ventral view of the myotube (arrowhead), with head pointing down. (C) Diagrammatic depiction of Sptb. Percentage identity between domains of β-spectrin homologs are indicated in black, where overall percentage identity is indicated in red. Domain II consists of 17 spectrin repeats arranged in coiled-coil helices. Repeat 15 (yellow shade) is required for binding to ankyrin, which in turn binds to band 3 (anion exchanger AE1). Repeat 17 (green shade) is required for ?head to head? association of αβ spectrin dimers. Domain I encompasses the actin binding domain (ABD) and is responsible for interactions with actin, adducin, centractin (ARP1 dynein), microtubule and protein 4.1 (and thereby glycophorin C). Domain III consists of the PH domain, which interacts with phosphotidylinositol-(4,5)-bisphosphate, βϒ G proteins, and protein kinase C. A C to T transversion mutation resulting in premature translation termination in repeat 8 in sptb (asterisk) is the molecular defect of the ris TB237 allele.
Image
Figure Caption
Acknowledgments
This image is the copyrighted work of the attributed author or publisher, and
ZFIN has permission only to display this image to its users.
Additional permissions should be obtained from the applicable author or publisher of the image.
Full text @ Development

