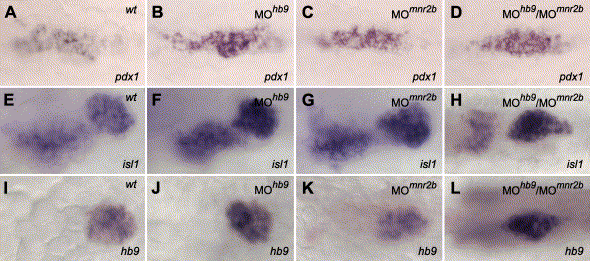
Fig. 5 mnr2b and hb9 are not required for the initiation of pancreas formation. Similar expression of pdx1 at 20 hpf (A?D), and isl1 (E?H) and hb9 (I?L) at 36 hpf in wild type embryos (A, E, I) and in embryos injected with 4 ng MOhb9 (B, F, J) or 4 ng MOmnr2b (C, G, K) or 4 ng MOhb9 and 4 ng MOmnr2b (D, H, L) (unchanged expression levels were found for A: n = 15/15, B: n = 16/16, C: n = 19/19, D: n = 15/16, E: n = 11/11, F: n = 9/11, G: n = 13/13, H: n = 10/13, I: n = 20/20, J: n = 12/15, K: n = 12/12, L: n = 21/23). Slightly reduced expression levels were found in few hb9 morphants (F: n = 2/11, J: n = 3/15) and hb9-mnr2b double morphants (D: n = 1/16, H: n = 3/13, L: n = 2/23). Notably, 2 of the uninjected embryos and 3 hb9 morphants showed split pdx1 expression, while expression levels were not changed. All embryos are shown from the ventral with anterior to the right. Expression of isl1 (E?H) marks prospective endocrine pancreas cells (right expression domain) and a population of cells that remains to be determined (left expression domain). Also note that the expression levels of pdx1, isl1 (right domain only) and hb9 are similar in morphants and wild types, while the endocrine expression domains of isl1 and hb9 are more condensed and extended along the anterior?posterior axis in hb9/mnr2b double morphants (H, L) than in the wild types (E, I) and single morphants (F, G, J, K). Scale bars correspond to 50 μm.
Reprinted from Developmental Biology, 268(2), Wendik, B., Maier, E., and Meyer, D., Zebrafish mnx genes in endocrine and exocrine pancreas formation, 372-383, Copyright (2004) with permission from Elsevier. Full text @ Dev. Biol.

